We show how to perform a Randomized Complete Block Design (RCBD) in Excel using regression. The approach is similar to that shown in ANOVA using Regression and uses dummy variables.
Example
The technique is illustrated for Example 1 of Randomized Complete Block Design.
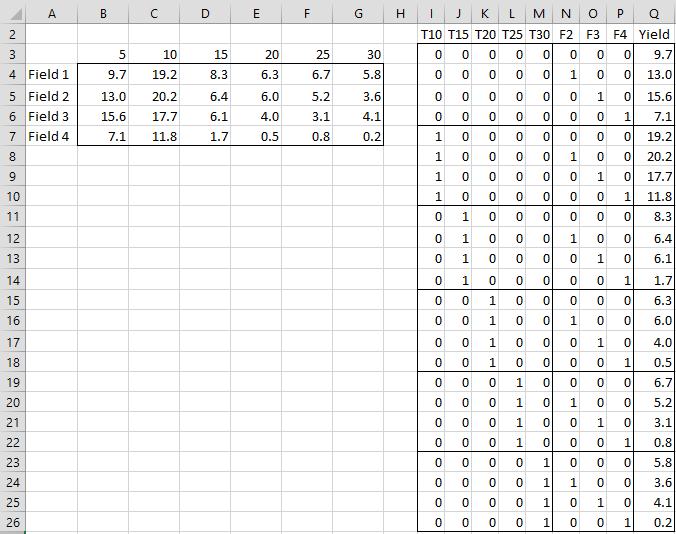
Figure 1 – Dummy coding of RCBD for regression
Figure 1 shows the dummy variable coding for Example 1. There are 5 dummy variables (T10, T15, T20, T25, T30) corresponding to the treatment groups. There are 3 dummy variables (F2, F3, F4) corresponding to the fields (the blocking factor). We now use the Real Statistics Multiple Regression data analysis tool with X Range I2:Q26 and Y Range R2:Q26 to get the output shown in Figure 2 (only the portion of the output that we need is displayed).
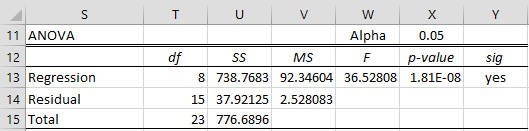
Figure 2 – Regression (full model)
Use of Regression Analysis Tool
Next, we use the Real Statistics Multiple Regression data analysis tool with X Range I2:M26 and Y Range R2:Q26 to get the output shown in Figure 3.
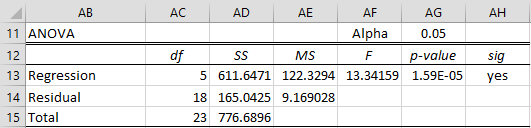
Figure 3 – Regression (subset model)
Using Figure 2 and 3, we can obtain the output shown in Figure 4.
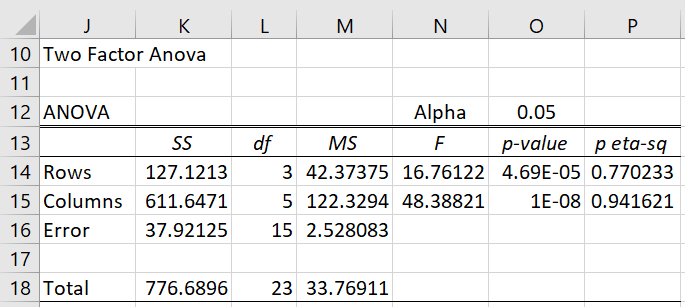
Figure 4 – RCBD using Regression
The Error and Total SS and df values come directly from Figure 2. E.g. cell AU17 and AU18 contain the formulas =U14 and =U15. The Groups value comes from Figure 3 (e.g. cell AU16 contains the formula =AD13). Finally, the Blocks values are derived by subtracting the Groups values from the Regression values of Figure 2 (e.g. cell AU15 contains the formula =U13-AU16).
Note that Figure 4 is identical to Figure 3 of Randomized Complete Block Design.