Real Statistics Data Analysis Tool: The Real Statistics Resource Pack supplies a Poisson Regression data analysis tool that automates the process of creating a Poisson regression model in Excel. In particular, it uses Newton’s method to estimate the regression coefficients.
Input
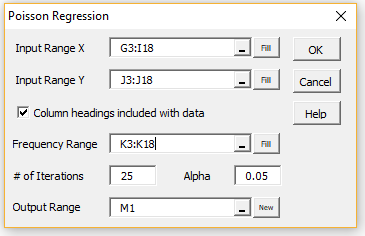
For example, to perform the analysis for Example 1 of Poisson Regression using Solver, press Ctrl-m and double-click on the Regression option in the dialog box that appears (or click on the Reg tab if using the Multipage user interface). Next, select the Poisson Regression option in the dialog box that appears and click on the OK button. Finally, fill in the dialog box that appears as shown in Figure 1, and press the OK button.
Here ranges G3:I18, J3:J18, and K3:K18 refer to Figure 1 in Poisson Regression using Solver.
Figure 1 – Poisson Regression dialog box
Output
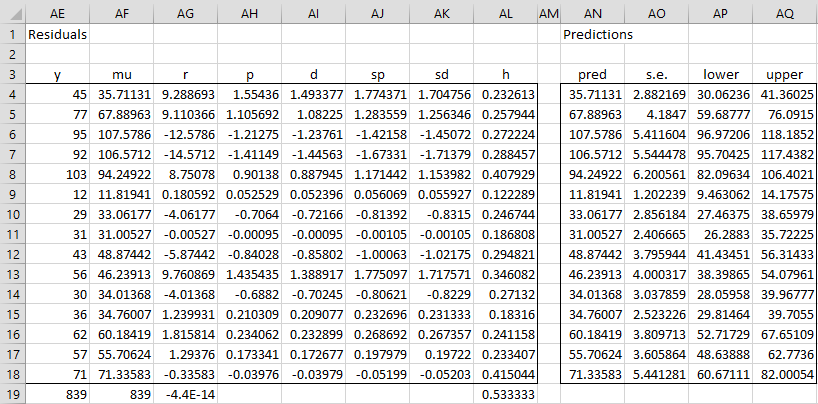
The output is shown in Figures 2 and 3.
Figure 2 – Poisson Regression analysis (part 1)
Figure 3 – Poisson Regression analysis (part 2)
Formulas
Note that LLmin (cell V13) is calculated by the formula
=SUMPRODUCT(AE4:AE18,LN(K4:K18))+AF19*LN(AE19/ SUM(K4:K18))-AE19-SUMPRODUCT(GAMMALN(AE4:AE18+1))
LLfit (cell V14) is calculated by the formula
=SUMPRODUCT(MMULT(DESIGN(G4:I18),N4:N7)+LN(K4:K18), AE4:AE18)-SUMPRODUCT(EXP(MMULT(DESIGN(G4:I18),N4:N7)), K4:K18)-SUMPRODUCT(GAMMALN(AE4:AE18+1))
LLmax (cell V15) is calculated by the formula
=SUMPRODUCT(AE4:AE18,LN(AE4:AE18))-AE19-SUMPRODUCT(GAMMALN(AE4:AE18+1))
Note too that the diagonal of the hat matrix (range AL4:AL18) is calculated by the array formula
=DIAG(MMULT(MMULT(AF4:AF18*DESIGN(G4:I18), MINVERSE(MMULT(TRANSPOSE(DESIGN(G4:I18)), AF4:AF18*DESIGN(G4:I18)))),TRANSPOSE(DESIGN(G4:I18))))
The covariance matrix (range V4:AB7) is calculated by the array formula
=MINVERSE(MMULT(TRANSPOSE(DESIGN(G4:I18)), AF4:AF18*DESIGN(G4:I18)))
Finally, the convergence vector (range AC4:AC7) is calculated by the array formula
=MMULT(Y4:AB7,MMULT(TRANSPOSE(DESIGN(G4:I18)),AG4:AG18))
The values in this array should be close to zero, demonstrating that the model converged to a solution within the specified number of iterations.
Worksheet Functions
Real Statistics Functions: The Real Statistics Resource Pack provides the following worksheet functions. These pertain to a Poisson regression model based on X data in Rx (with k columns), Y data in Ry, and frequency data in Rt. If Rt is omitted it defaults to a column of ones. Rm is a column that contains the mu values.
PoissonLL(Rx, Ry, Rc, Rt): returns the LL fitted value.
PoissonLL0(Ry, Rt): returns the LLmin value
PoissonLL1(Ry): returns the LLmax value
PoissonCovX(Rx, Ry, Rc, Rt): returns the coefficient covariance matrix
PoissonHat(Rx, Rm): returns the diagonal of the hat matrix
The values in range V13:V15 can also be calculated by the formulas PoissonLL0(J4:J18, K4:K18), PoissonLL(G4:I18, J4:J18, N4:N7, K4:K18), and PoissonLL1(J4:J18).
We can also use the array formula PoissonCovX(G4:I18, J4:J18, N4:N7, K4:K18) to output the covariance matrix in range Y4:AB7. Finally, we can use the array formula PoissonHat(G4:I18, AF4:AF18) to output the values in range AL4:AL18.
Examples Workbook
Click here to download the Excel workbook with the examples described on this webpage.
References
Hintze, J. L. (2007) Poisson regression. NCSS
https://www.ncss.com/wp-content/themes/ncss/pdf/Procedures/NCSS/Poisson_Regression.pdf
Nussbaum, E. M., Elsadat, S., Khago, A. H. (2007) Best practices in evaluating count data, Chapter 21: Poisson regression.
http://www.academia.edu/4387460/BEST_PRACTICES_IN_ANALYZING_COUNT_DATA_Poisson_Regression
Penn State (2017) Poisson regression. STAT 504: Analysis of discrete data.
https://online.stat.psu.edu/stat504/Lesson09


Hi
I tried the tool on a dataset where the y values can be quite high (>1000) although not high relative to the frequency (>20000). The tool produced a model but the values for LL min, fit and max and the Rsquared value were all returned as Null which I believe is because Excel cannot calculate Factorials for such high values absolute values of y. The count data is left skewed and non-negative and is the count of support calls into a call centre with the frequency representing the volume of sales. It feels like Poisson Regression is theorectically a potention fit.
Are there any tips for situations like this
Thanks
Rob
Hi Rob,
If you email me your data and results, I will try to figure out what to do.
Charles
I think the phi correction is incorrectly applied to adjust the se values in the tool. It should be adjusted by the sqrt(phi), not phi itself. Multiplying the variance matrix by the given phi value does not result in the same adjusted se value given in the results table.
James,
Yes, you are correct. The standard error is adjusted by the square root of phi.
I thought that I had done that. Can you point me to a place where I adjusted the se by phi and not by the sqrt(phi)?
Charles
James,
If I multiply the variance matrix by the constant phi then the variances will be multiplied by phi, doesn’t that mean that the standard errors will be multiplied by sqrt(phi)?
Charles