Using Hotelling’s T-square Test
Hotelling’s T-square test can be used instead of a One Factor Repeated Measures ANOVA (1W+0B), especially when the sphericity assumption doesn’t hold. We illustrate the approach by repeating Example 1 of One Factor Repeated Measures ANOVA.
Example set-up
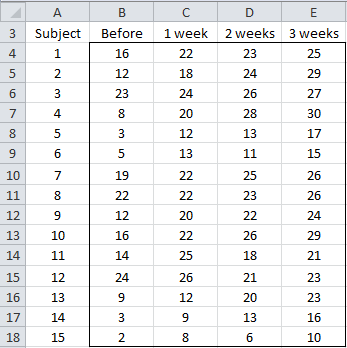
Example 1: A program has been developed to reduce the levels of stress for working women. In order to determine whether the program is successful a sample of 15 women was selected and their level of stress was measured (low scores indicate higher levels of stress) before the program, as well as 1, 2, and 3 weeks after the beginning of the program. Based on the data in Figure 1 (range G5:K20) determine whether the program is effective in reducing stress.
Figure 1 – One factor repeated measures data
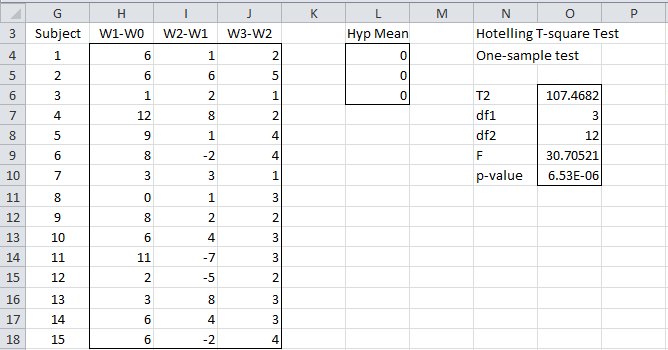
The approach we use is to test whether the differences between the data in the successive columns of Figure 1 all have a mean of zero. Relabeling Before as W0 and the other timeframes as W1, W2, and W3 we obtain the data in range H3:J18 of Figure 2. E.g. entering the formula =C4-B4 in cell H4 of Figure 2, highlighting range H4:J18 and pressing Ctrl-D, and then Ctrl-R fills out the data in range H4:J18.
Figure 2 – One Factor Repeated Measures test via Hotelling’s Test
Example results
We now perform a one-sample T-square test using the formula
=Hotelling(H4:J18,L4:L6,0,TRUE)
The result is shown in range N6:O10. Since p-value = 6.53E-06 < .05 = α, we reject the null hypothesis that Columns H, I, and J all have mean zero. But this null hypothesis is equivalent to the mean of W0 is equal to the mean of W1, the mean of W1 is equal to the mean of W2, and the mean of W2 is equal to the mean of W3, which in turn signifies that W0, W1, W2, and W3 all have the same mean. Our result rejects this hypothesis.
Note too that we could use the formula =Hotelling(H4:J18,,,TRUE) since in this case, the second argument defaults to a zero column array with n rows where n = the number of columns in the first argument.
Worksheet Function
We can also use some Real Statistics capabilities to carry out this test directly.
Real Statistics Function: The Real Statistics Resource pack contains the following array function:
T2_RepeatedMeasures(R1, lab) = a 5 × 1 column range with values T-square, df1, df2, F and p-value for Hotelling T-square test for repeated measures design based on the data in R1 (w/o headings) if lab = FALSE (default). If lab = TRUE then the output is instead a 5 × 2 range whose first column contains labels.
If we place the formula =T2RepeatedMeasures(H4:J18, TRUE) in range N6:O10 and press Ctrl-Shft-Enter the output is as shown in Figure 3.
Data Analysis Tool
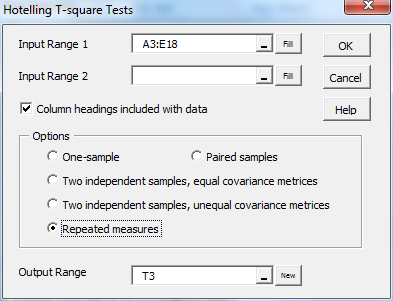
Real Statistics Data Analysis Tool: Hotelling’s T-square data analysis tool contains an option for carrying out the repeated measures test described above.
For Example 1, press Ctrl-m and select the Hotelling’s T-square option from the Multivar tab (or from the Multivariate Analyses option if using the original user interface). Now fill in the fields in the dialog box that appears as shown in Figure 3 and click on the OK button.
Figure 3 – Hotelling’s T-square test dialog box
The output is as shown in range N3:O10 of Figure 2.
Examples Workbook
Click here to download the Excel workbook with the examples described on this webpage.
References
Rencher, A.C. (2002) Methods of multivariate analysis (2nd Ed). Wiley-Interscience, New York.
http://math.bme.hu/~csicsman/oktatas/statprog/gyak/SAS/eng/Statistics%20eBook%20-%20Methods%20of%20Multivariate%20Analysis%20-%202nd%20Ed%20Wiley%202002%20-%20(By%20Laxxuss).pdf


❤️
Hi! How do we analyze if we add another dependent variable measured four times also, say, in addition to stress levels, we also measure hours of sleep. Do we have a way to test for significant difference simultaneously? I thought that was the repeated-measures manova whereby there are more than one dependent variable each measured several times. Thank you very much!
Jay,
It does sound like a fit for MANOVA.
Charles
Is this statement correct … “The result is shown in range N6:O10. Since p-value = 6.53E-06 < .05 = α, we conclude that there is no reason to reject the null hypothesis that Columns H, I and J all have mean zero." Give a p-value < 0.001 wouldn't we reject the null hypothesis.
Jeff,
The statement is wrong. It should say that we reject the null hypothesis. I have just corrected this on the webpage.
Thank you very much for catching this error. I really appreciate your help, especially since this error would really confuse a lot of readers.
Charles
In the above paragraph (Observation:) you mention the Whitney Signed Rank test. But, in the list of non-parametric methods, there is the Mann-Whitney test or the Wilcoxon Signed-Rank test, but no Whitney Signed Rank test. Which do you mean?
Roger,
Thanks for pointing this out. It should say “Wilcoxon” instead of “Whitney”. I have now changed this.
Charles