Worksheet Functions
The Real Statistics Resource Pack provides the following support for the Bayesian Signed-Ranks Test. In the following, R1 is a column array of difference values.
BayesSRT(R1): returns a column array with n and T+ where n = the # of non-zero numeric entries in R1
The following functions output a column array with various characteristics of the Signed-Ranks test. If lab = TRUE (default FALSE) then a column of labels is appended to the output.
BayesSRSm(R1, lab, iter, alpha, lprec, uprec): returns an array with n, T+, mean, median, mode, 1-alpha HDI lower/upper, 1-alpha equal-tailed CI lower/upper, and hypothesis test BF01, BF10, P(H0|X) and P(H1|X) based on the null hypothesis μ < .5. The output is based on a grid created using 200 phi values starting from .0025 in increments of .005 based where each grid entry is calculated using iter-many Monte Carlo samples (default iter = 30000). lprec and uprec are defined as for GRID_HDI.
BayesSRLg(R1, lab, a, b, alpha): returns an array with n, T+, posterior Beta parameters, mean, median, mode, 1-alpha HDI lower/upper, 1-alpha equal-tailed CI lower/upper, and hypothesis test BF01, BF10, P(H0|X) and P(H1|X) based on the null hypothesis μ < .5. The output is based on a Beta distribution approximation using a Beta prior with parameters a (default 1) and b (default 1).
Real Statistics also provides the following function which outputs 200 grid entries:
BayesSRX(R1, iter): outputs a column array with 200 grid entries, as described above, where each entry is calculated using iter-many Monte Carlo samples (default iter = 30000).
More Worksheet Functions
Real Statistics also provides the following worksheet functions where R1 is replaced by n and T+:
BayesSR1Sm(n, tplus, lab, iter, alpha, lprec, uprec): equivalent to BayesSRSm for any array R1 which has n non-zero entries and has a T+ value equal to tplus based on ranks with no ties.
BayesSR1Lg(n, tplus, lab, a, b, alpha): equivalent to BayesSRLg for any array R1 which has n non-zero entries and has a T+ value equal to tplus based on ranks with no ties.
Finally, Real Statistics supports the following worksheet functions:
BayesSR1(arg1, tplus, phi, iter) = estimated likelihood value corresponding to the specified phi and T+ values based on the column array of ranks in arg1 using iter-many Monte Carlo samples (default iter = 30000). If arg1 is instead a positive integer n, then the ranks 1, 2, …, n with no ties is used.
BayesSR1X(arg1, tplus, iter): returns a column array with 200 rows consisting of estimated pdf values for the specified T+ value and each of 200 phi values starting from .0025 in increments of .005 based on the column array of ranks in arg1 where each grid entry in the output is calculated using iter-many Monte Carlo samples (default iter = 30000). If arg1 is instead a positive integer n, then the ranks 1, 2, …, n with no ties is used.
Examples
The following examples refer to Example 1 on Bayesian Signed Ranks Test and the various figures on that webpage.
The data in cell Z2 of Figure 3 can be obtained by the formula =BayesSR1(E$2:E$14,F$15,Y2) or =BayesSR1(12,F$15,Y2). The values in range AA2:AA201 of that figure can be obtained using the array formula =BayesSR1X(E$2:E$14,F$15) or =BayesSR1X(12,F$15).
Referencing Figure 1, the same result can be obtained via the formula =BayesSRX(C2:C14) or =BayesSRX(B2:B14-A2:A14). We can obtain the values n = 12 and T+ = 65 for Example 1 (e.g. in range AM2:AM3 of Figure 5 by using the formula =BayesSRT(C2:C14) or =BayesSRT(B2:B14-A2:A14).
The results in Figure 4 can be obtained by using the formula =BayesSRnSm(12,65,TRUE). These results can also be obtained via the formula =BayesSRSm(C2:C14,TRUE). In this case, the output also includes the values n = 12 and T+ = 65.
The results shown in range of AQ2:AR14 of Figure 5 can be obtained by using the formula BayesSR1Lg(AM2, AM3, TRUE). These results can also be obtained via the formula BayesSRLg(C2:C14,TRUE). In this case, the output also includes the values n = 12 and T+ = 65.
Data Analysis Tool
Example 1: Repeat Example 1 from Bayesian Signed Ranks Test using the Bayesian Signed Ranks data analysis tool.
Press Ctrl-m and select the Bayesian Signed Ranks option from the Bayes tab. Next, fill in the dialog box that appears as shown in Figure 1.
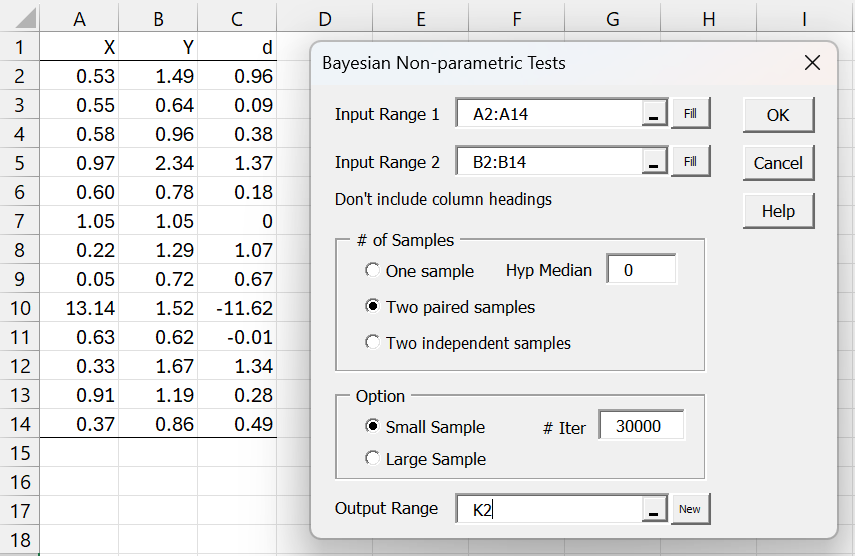
Figure 1 – Bayesian SR Test dialog box
After clicking on the OK button, the output shown in Figure 1 appears.
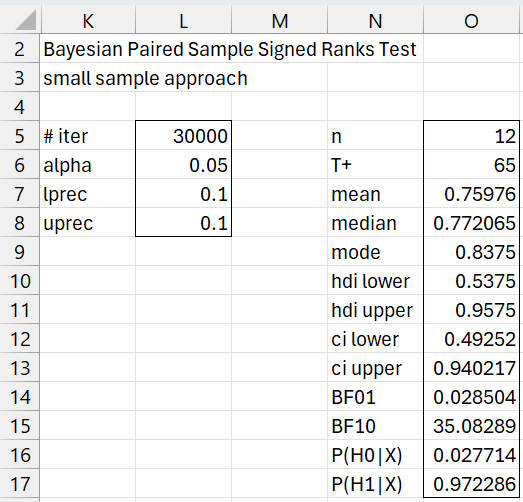
Figure 2 – Bayesian SR Test (small sample)
If you change any of the values in range L5:L8, the output in range O5:O17 will change accordingly.
Example 2: Construct the large sample version of the signed ranks test for Example 1.
We repeat the process described above, selecting the Large Sample option in Figure 1, leaving the other options as they are displayed in Figure 1. Alternatively, we can insert C2:C14 in Input Range 1, leave Input Range 2 empty, and choose the One sample option.
In this latter case, we obtain the results shown in Figure 3.
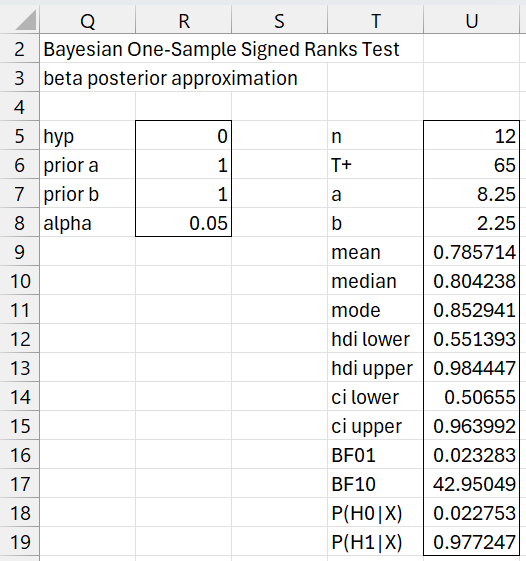
Figure 3 – Bayesian SR Test (large sample)
If you change any of the values in range R5:R8, the output in range U5:U19 will change accordingly.
Examples Workbook
Click here to download the Excel workbook with the examples described on this webpage.
References
Kruschke, J. K. (2015) Doing Bayesian data analysis. 2nd Ed. Elsevier
https://sites.google.com/site/doingbayesiandataanalysis/
Chechile, R. A., Barch, D. H. Jr. (2025) Distribution-free Bayesian analyses with the DFBA statistical package
https://link.springer.com/article/10.3758/s13428-025-02605-6