Basic Concepts
The structural model for the two random factor model is similar to that for the two fixed factor model.
![]()
We assume that for all i, j, and k, εijk, αi, βj, and (αβ)ij are pairwise independent and
Thus we have
The null and alternative hypotheses for the main effects and interaction are as follows:
![]()
![]()
![]()
The definitions of SSA, SSB, SAB, SSE, and similarly for the MS and df terms are exactly the same as for the two fixed-factor model described in Two Factor ANOVA. We also have (using a and b in place of r and c):
![]()
![]()
![]()
![]()
Hypotheses
In order to conduct the proper F tests, we need to modify the approach used for two fixed-factor ANOVA. As there we want a ratio which is 1 when the null hypothesis is true and greater than 1 when the alternative hypothesis is true. For the A and B main factors we, therefore, need to use MAB as the denominator when calculating F. This can be done as follows:
| Test Desired | Null H0 | Alt Hyp H1 | Statistical Test |
| Factor A Effect | |
|
|
| Factor B Effect | |
|
|
| Interaction Effect | |
|
Estimates of Variances
With a balanced model, we can estimate and construct a confidence interval based on
![]() Again, assuming a balanced model (Satterthwaite), we can estimate
Again, assuming a balanced model (Satterthwaite), we can estimate ,
,
and
and construct the corresponding confidence interval based on
![]()
Data Analysis
Real Statistics Data Analysis Tool: The Real Statistics Resource Pack provides an option for the Two Factor ANOVA data analysis tool which supports random models.
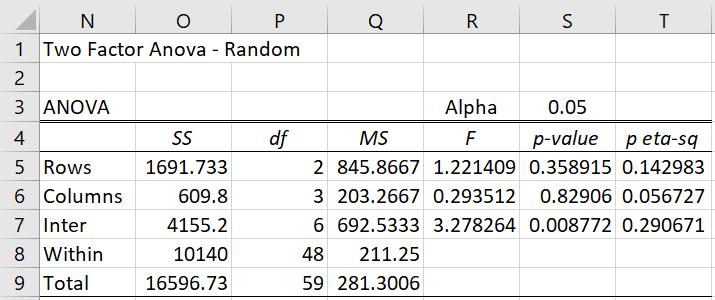
This analysis can be done as described in Two Mixed Factors ANOVA, where both the row and column factors are random. This corresponds to performing Example 1 of Two Mixed Factors ANOVA where the three anti-terrorism training courses being analyzed are randomly chosen from a large number of possible training courses. In Figure 5 of Two Mixed Factors ANOVA you would choose the Anova – Random instead of Anova – Mixed as the Analysis Type.
Figure 1 displays the output.
Figure 1 – Two Random Factor ANOVA
Examples Workbook
Click here to download the Excel workbook with the examples described on this webpage.
References
Howell, D. C. (2010) Statistical methods for psychology (7th ed.). Wadsworth, Cengage Learning.
https://labs.la.utexas.edu/gilden/files/2016/05/Statistics-Text.pdf
PennState (2023) Random effects and introduction to mixed models
https://online.stat.psu.edu/stat502/lesson/6


Hello Charles,
In this scenario, where the interaction between factors is significant, what should we do next?
Let’s say that my goal is to compare different population behaviours (these two populations come from the same sample) and I obtain the ANOVA table you got.
After it, what should I do? Since the interaction is significant the only conclusion I can make is that both populations follow a certain variance or can I make comments regarding the performance of one and another.
Thanks
Hello Bernardo,
For two-way ANOVA with fixed factors, yoy could use Tukey’s HSD on the interaction effect.
I am not 100% certain, but you can probably use the same approach for random factors provided you use the correct standard error from the ANOVA.
Charles
Charles,
Is the above “two random factors ANOVA” implemented in the software, the same way the single random factor ANOVA is implemented such that it gives the estimated variances for each factor, in addition to the fixed-factor outputs? Currently in the output there is no difference for two-factor random/fixed/mixed/regression outputs (that I can see). But then I had a Run-time error ‘401’: Can’t show non-modal from when modal form is displayed”. Is the problem on my end?
Thank you.
Heather,
The Two Random Factor ANOVA and the Two Mixed Factor ANOVA give the same results. The Two Fixed Factor ANOVA gives a different result. I can provide a way of estimating the population variance of a random factor, but I haven’t included this in the software yet. Is this useful to you?
As far is the run time error is concerned, I have not seen the error message “Can’t show non-modal from when modal form is displayed” before, and I don’t know what would cause this. What version of Excel are you using and what operating system (Windows 8, Windows 7, Mac OS, etc.)?
Generally when a run-time error occurs, it is because there is some conflict in the way decimals are displayed in Excel for some languages (0,05 instead of 0.05). I have addressed this (at least in the past for French, Italian and German) so that it doesn’t occur that often anymore, but it seems to still occur for some languages (Bulgarian was the latest one found). It doesn’t sound like this is the problem in your case, but if it is, then simply re-enter the decimal value when it appears in a Real Statistics dialog box instead of using the default value (even if they look identical).
Charles
Hi Mr. Zaiontz,
I have a problem. I am trying to do an ANOVA with two random factors and one fixed factor. What should I do? I tried to do the two random factors ANOVA on Excel, but I must use my fixed factor.
Sorry, but the only three factor ANOVA that I have described on the website or implemented in the software thus far is for three fixed factors.
Charles