Introduction
In the case of Two-factor ANOVA without Replications, there is no interaction term (it is subsumed in the error term), and so there is no straightforward way to determine whether the interaction effect is significant. Instead, we can use Tukey’s Additivity Test to determine whether the interaction between the factors is indeed significant.
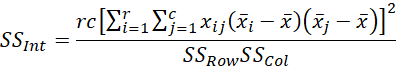
This is done by creating an estimated interaction factor in the analysis and subtracting this from the usual error term. For this factor df = 1 and SSInt is set equal to
We illustrate how this is done via the following example.
Example
Example 1: Determine whether there is a significant interaction effect between the row and column factors for the data in range A2:C6 of Figure 1.
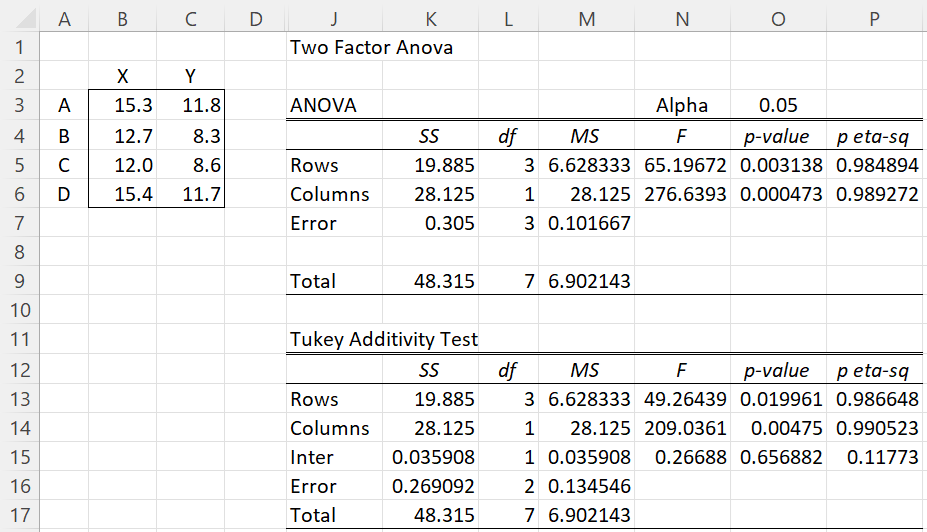
Figure 1 – Data, ANOVA, and Tukey Additivity Test
First, we perform the usual two-factor ANOVA test without replications, using the Real Statistics’ Two Factor Anova data analysis tool (setting the Input Range field to A2:C6 and the Number of Rows per Sample field to 1). The output is shown in range J1:P9 of Figure 1.
We now build the table for the Tukey Additivity Test, as shown in range J11:P17. The SS, df, and MS values for the Rows, Columns, and Total for the Tukey Additivity Test are the same as those from ANOVA. The hard part is how to separate the ANOVA Error row into the Interaction and new Error. df for the Interaction is set to 1, and so df for the new Error is 3-1 = 2 (as shown in cell L16).
Calculating SS Interaction
We calculate SS for the Interaction as shown in Figure 2.
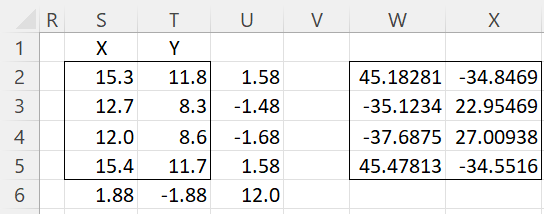
Figure 2 – Calculation of SS Interaction
The xij values in range S2:T5 are the original data values, as taken from B3:C6 of Figure 1. The grand mean x̄ (cell U6) is calculated by =AVERAGE(S2:T5). We now calculate the x̄i – x̄ and x̄j – x̄ values as shown in U2:U5 and S6:T6. We insert the formula =AVERAGE(S2:T2)-U$6 in cell U2, highlight U2:U5, and press Ctrl-D. Next, we insert the formula =AVERAGE(S2:S5)-$U6 in cell S6, highlight S6:T6, and press Ctrl-R.
Finally, we fill in range W2:X5 by inserting the formula =S2*$U2*S$6 in cell W2, highlight W2:X5, and press Ctrl-R and Ctrl-D. We can now calculate the SS Interaction value in cell K16 of Figure 1 via the formula =SUM(W2:X5)^2*COUNT(W2:X5)/(K13*K14). MS Interaction in cell M16 is calculated in the usual way via the formula =K16/L16.
Completing the analysis
The SS for the new Error in cell K17 is calculated via the formula =K7-K15 and the MS by =K17/L17. All the other values in Figure 1 are calculated in the usual way using the new Error MS value.
Since p-value = .656882 > .05 = alpha, we conclude that the interaction is not significant.
Finally, note that we didn’t actually need the range W2:X5. Instead, we could have placed the following array formula in cell K16
=SUM(S2:T5*U2:U5*S6:T6)^2*COUNT(S2:T5)/(K13*K14)
Worksheet Function
Real Statistics Function: The Real Statistics Resource Pack provides the following worksheet function.
ADDITIVITY_ANOVA(R1) = p-value of Turkey’s Additivity Test for the data in R1 in Excel format.
For Example 1, the formula =ADDITIVITY_ANOVA(B3:C6) returns the value .656882, the same as the value shown in cell O15.
If R1 contains data in standard (stacked) format, then you need to use the array formula =ADDITIVITY_ANOVA(StdAnova2(R1)) to perform the additivity test.
Examples Workbook
Click here to download the Excel workbook with the examples described on this webpage.
References
Wikipedia (2022) Tukey’s test of additivity
https://en.wikipedia.org/wiki/Tukey%27s_test_of_additivity
Montgomery, (2013) Design and analysis of experiments, 5th ed. Wiley
https://books.google.it/books/about/Design_and_Analysis_of_Experiments.html?id=scDRAAAACAAJ&redir_esc=y