Premise
As we describe in Normality Testing of ANOVA Residuals, ANOVA is actually a form of regression. As a result, we can speak about residuals, i.e. the difference between actual data and the values predicted by the regression model. For our purposes, we don’t need to go into the details here. For those who are interested, see ANOVA using Regression.
What is important is to recognize that the normality assumption for Factorial ANOVA is that these residuals be normally distributed. As a result, it is important to understand how to identify these residuals. Once this is done, we can apply any of the various tests for normality, especially QQ-plots, Shapiro-Wilk test, d’Agostino-Pearson test, etc.
Residuals for Two Factor ANOVA
For two-way ANOVA, the residuals turn out to be the difference between the actual data elements xijk and the interaction means mij, i.e. xijk – mij.
Two Factor ANOVA Example
Example 1: Determine the residuals for the data on the left side of Figure 1. Then determine whether the normality assumption for two-way ANOVA is met.
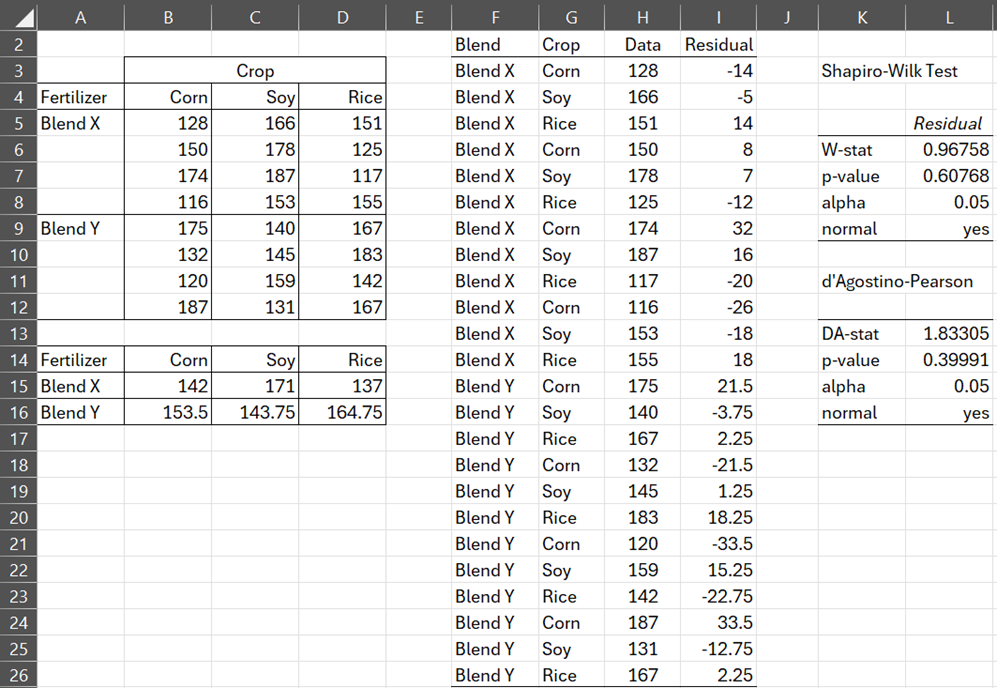
Figure 1 – Normality for two-way ANOVA
For this example, there are two Row factor levels and three Column factor levels for 2 × 3 = 6 interactions. The mean for each of these interactions is shown in range A14:D16.
It is easier to obtain the residuals if the data is in stacked format. This is obtained by using the formula =Anova2Std(A4:D12,4), as shown in range F3:H26. We now obtain the residuals (displayed in column I) by subtracting the appropriate element in A14:D16 from the values in column H. More precisely, we insert the formula
=H3-INDEX(B$15:D$16,MATCH(F3,A$15:A$16,0),MATCH(G3,B$14:D$14,0))
in cell I3, highlight range I3:I26, and press Ctrl-D.
The Shapiro-Wilk test result of p-value = .60768 on range I3:I26 shows that the residuals are normally distributed.
Worksheet Function
Real Statistics Function: The Real Statistics Resource Pack provides the following worksheet function.
Anova2Res(R1): returns a column array with the residuals for two-way ANOVA on the data in R1 in standard (stacked) format (i.e. three column array with row labels in the first column, column labels in the second column and numeric values in the third column).
We obtain the same results shown in column I of Figure 1 by using the formula =Anova2Res(F3:H26) or equivalently the array formula =Anova2Res(Anova2Std(A4:D12,4)).
Residuals for Three Factor ANOVA
For three-way ANOVA, the residuals again turn out to be the difference between the actual data elements and the interaction means.
Three Factor ANOVA Example
Example 2: Determine the residuals for the data in range A3:F15 of Figure 2 and determine whether the normality assumption for three-way ANOVA is met.
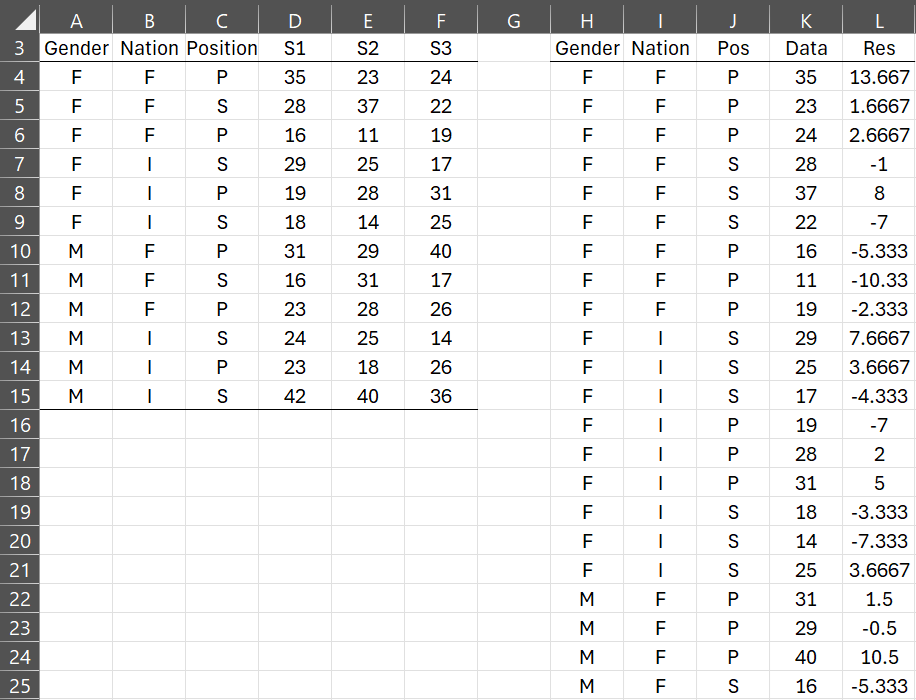
Figure 2 – Normality for three-way ANOVA (part 1)
As for two-way ANOVA, it is easier to find the residuals if the data is in stacked format by columns instead of by rows. We therefore use the formula =Anova3Cols(A4:F15) to reformat the data as shown in range H4:K39 (although rows 26 through 39 are not displayed).
Since each of the factors has 2 levels, there are a total of 23 = 8 combinations, as shown in range N4:P11 of Figure 3.
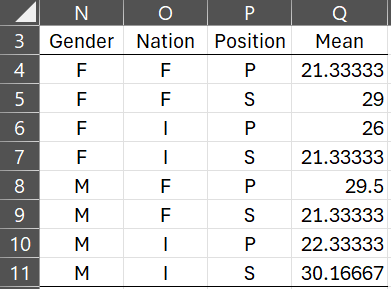
Figure 3 – Interaction means
We now find the mean for each of these 8 interactions by placing the formula
=AVERAGEIFS(K$4:K$39,H$4:H$39,N4,I$4:I$39,O4,J$4:J$39,P4)
in cell Q4, highlighting range Q4:Q11, and pressing Ctrl-D.
We now obtain the residuals by inserting the formula
=K4-SUMIFS(Q$4:Q$11,N$4:N$11,H4,O$4:O$11,I4,P$4:P$11,J4)
in cell L4 (of Figure 2), highlighting the range L4:L39, and pressing Ctrl-D.
Finally, we use the Shapiro-Wilk and d’Agostino-Pearson tests, as shown in Figure 4, to confirm that the residuals are normally distributed.
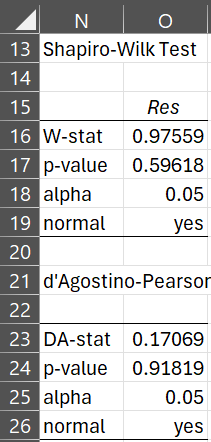
Figure 4 – Normality for three-way ANOVA (part 2)
Worksheet Function
Real Statistics Function: The Real Statistics Resource Pack provides the following worksheet function.
Anova3Res(R1): returns a column array with the residuals for three-way ANOVA on the data in R1 in standard (stacked) format (i.e. four-column array with labels in the first, second, and third columns, and numeric values in the fourth column).
We obtain the same results in range L4:L39 of Figure 4 by using the array formula =Anova3Res(H4:K39) or equivalently the array formula =Anova3Res(Anova3Cols(A4:F15)).
Examples Workbook
Click here to download the Excel workbook with the examples described on this webpage.
References
GraphPad (2024) Residuals tab: One-way ANOVA
https://www.graphpad.com/guides/prism/latest/statistics/stat_1wayanova_residuals-tab.htm
Minitab (2024) Does the response need to follow a normal distribution?
https://support.minitab.com/en-us/minitab/help-and-how-to/statistical-modeling/anova/supporting-topics/anova-models/does-the-response-need-to-be-normal/#:~:text=ANOVA%20assumes%20that%20the%20residuals,assumptions%20of%20ANOVA%20are%20met.