Basic Concepts
A measurement system contains variation from three main sources: the parts or products being measured, the operator (aka appraiser) taking the measurements, and the equipment used to perform the measurements.
A Gage Repeatability and Reproducibility (Gage R&R) study is used to identify the contribution of each of these sources of the variation in the measurement process (called precision). The main focus of the study is on determining whether the measurement system is adequate for its intended use. Such a study evaluates several parts that are repeatedly measured (called trials) by multiple operators. A typical study is done by three operators who measure 10 parts at least three times each. The level of variation is then calculated among the operators and parts, across the trials.
The operators should randomly sample the production across all the major sources of process variation (parts produced, equipment used, equipment calibration, shift, time between measurements, etc.). It is essential that they choose part samples that represent the true variation of the production process; otherwise, the study will be worthless.
We conduct the actual analysis using two-factor ANOVA.
Example
Example 1: Conduct a Gage R&R analysis for the data in Figure 1, which shows the measurements (Meas) done by two operators (Op) on five parts (Part) based on two trials.
Figure 1 – Data for Gage R&R study
Two-Factor ANOVA
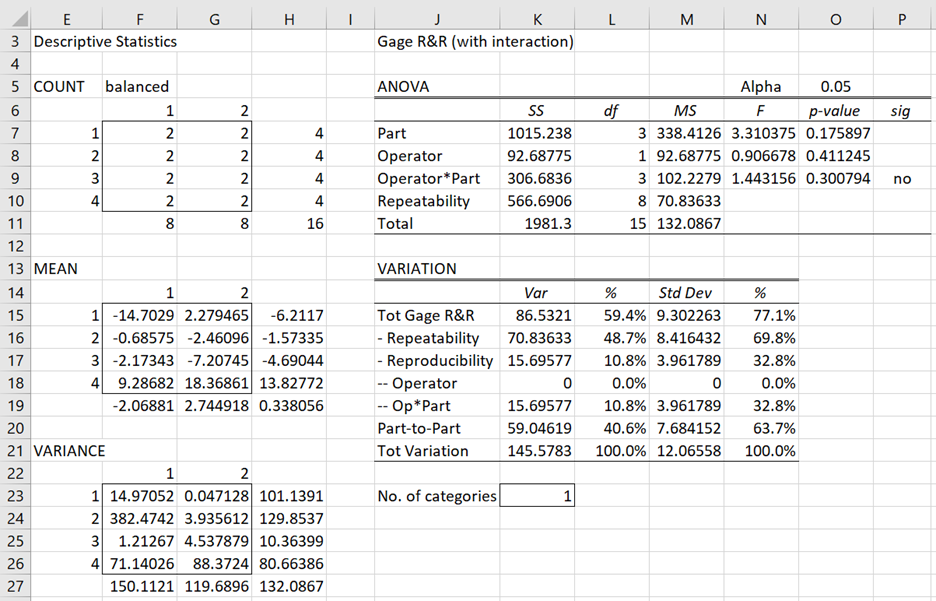
You can conduct the analysis by performing a two-fixed factor ANOVA as described in Two Factor ANOVA with Replications and Real Statistics Support for Two Factor ANOVA. The ANOVA output is shown in Figure 2, although the data in range J13:N23 are not part of the ANOVA output, but have been added (as described below) to complete the Gage R&R analysis.
Figure 2 – Gage R&R using ANOVA
Note that the error term has been relabeled Repeatability (cell J10). The F values in cells N7, N8, and N9 are calculated by the formulas =M7/M9, =M8/M9, and =M9/M10, respectively (with p-values in column N based on these F values).
Modification since interaction is not significant
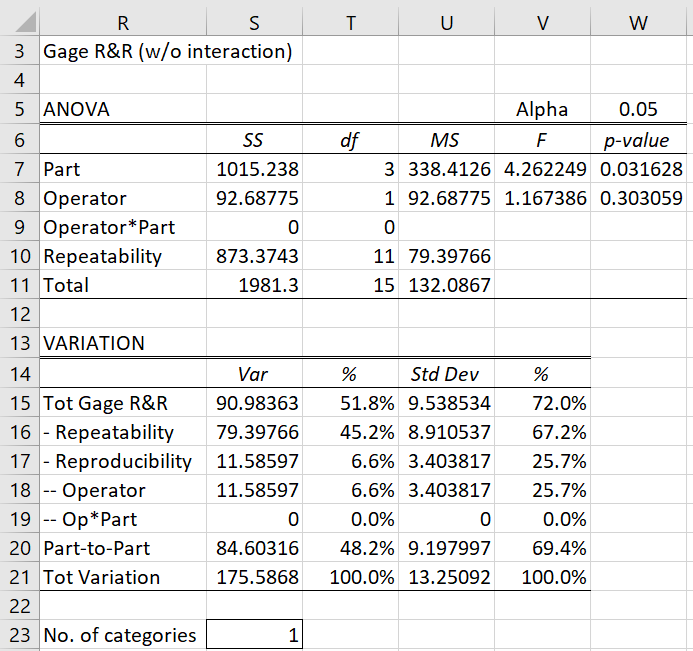
Since the interaction effect (i.e. Operator*Part) is not significant (cell P9), the ANOVA output needs to first be modified by including the interaction values in the Repeatability term, as shown in the top part of Figure 3.
Figure 3 – Gage R&R based on modified ANOVA
Thus, cell S9 contains a zero, S10 contains the formula =K9+K10, cell T10 contains the formula =L9+L10 and cell U10 contains the formula T10/S10. Cells V7 and V8 contain the formulas =M7/M10 and =M8/M10, respectively (with p-values in column W based on the F values).
Gage R&R report
We now explain the Gage R&R report shown in the bottom part of Figure 3. Figure 4 describes the value of each of the sources of variability (i.e. the Variation column, column S). Column T shows the percentage of each variation component (divided by the Total Variation in cell S21). Column U shows the standard deviation of each variation component (i.e. the square root of the corresponding variation component) and column V shows the percentage of each of these standard deviations (divided by the total standard deviation).
| Variability Source | Description | Cell | Formula |
| Total Gage R&R | Repeatability + Reproducibility | S15 | =S16+S17 |
| Repeatability | Variability from repeated measures by the same operator | S16 | =U10 |
| Reproducibility | Variability from measurements of the same part by different operators | S17 | =S18+S19 |
| Operator | Variability across different operators | S18 | =MAX((U8-U9) /(G7*(T7+1)),0) |
| Operator*Part | Measurement variability across different operator/part combinations | S19 | 0 (since Op*Part is insignificant) |
| Part-to-Part | Measurement variability across different parts | S20 | =MAX((U7-U9) /(G7*(T8+1)),0) |
| Total Variation | Total variability | S21 | =S15+S20 |
Figure 4 – Sources of Variability
Report details
Part variation (Part-to-Part) measures the variation in the parts used in the study. A value less than 30% indicates that the parts chosen do not represent the true variation in the production process.
Operator variation represents the reproducibility of the system. A value greater than 30% indicates high operation-to-operation variability, possibly caused by operators not following the correct measurement procedures or not being trained properly.
Total Gage R&R represents the variability of the measurement system, including both the (measurement) equipment variation and the operator variation. A value of 10% or less indicates that the system is acceptable, in which case most of the variation is from the parts and not the measurement system. A value of 30% or higher indicates that the measurement system is not acceptable and must be improved. Finally, a value between 10% and 30% indicates that the measurement system may be considered acceptable but a plan for improvement should be developed.
The number of distinct categories (cell S23 of Figure 3) is another indicator of whether there is enough variability in the selection of the parts for the study. For Example 1, the number of distinct categories is calculated by the Excel formula =MAX(1,TRUNC((U20/U15)*SQRT(2))). This value should be at least 5; otherwise, the study is not considered to be valid.
Data Analysis Tool
Real Statistics Data Analysis Tool: The Real Statistics Resource Pack provides the Gage R&R data analysis tool to implement the capabilities described above.
Example 2: Use the Gage R&R data analysis tool to perform the study for the data in Figure 5.
Figure 5 – Data in Excel ANOVA format
This time we have 3 operators, 5 parts, and 4 trials by each operator for each part. The data is arranged in two-factor ANOVA Excel format.
To perform the analysis, press Ctrl-m and select the Anova – two factor option from the Anova tab (or from the Analysis of Variance option if using the original user interface) and fill in the dialog box that appears as shown in Figure 6.
Figure 6 – Two Factor Anova dialog box
When you click on the OK button, the output shown in Figure 7 is displayed (although we have not included the descriptive statistical information, which is similar to that shown in range E3:H27 of Figure 2).
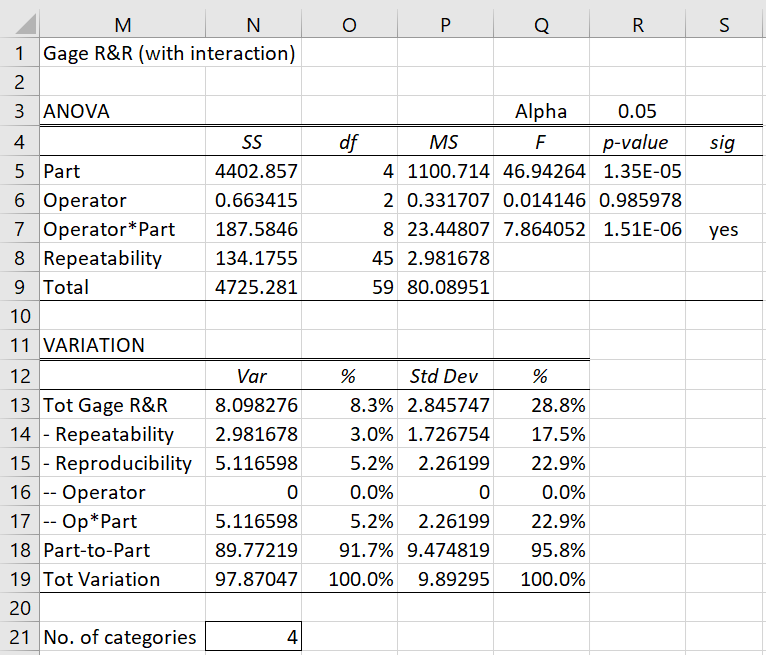
Figure 7 – Gage R&R data analysis
Significant interaction
This time the interaction factor is significant (cell S7) and so will be included in the analysis and not merged into the Repeatability (error) terms. The formulas used are identical to those used in Figure 2. The formulas used for the Sources of Variation part of the figure are exactly as those shown in Figure 4. The data analysis tool will also generate the Gage R&R analysis without intercept (similar to that shown in Figure 3), although this should not be used (unless you change the alpha value in cell R3 of Figure 7 so that a non-significant result is now displayed in S7).
The rest of the analysis is similar to that shown in Figure 2, except that this time the study gives evidence that the measurement system is acceptable since Total Gage R&R = 8.3% < 10% and most of the measurement variation is part-to-part (91.7% in cell O18). A word of caution: since only 5 parts are measured and the number of distinct categories = 4 < 5, we should be somewhat cautious about the results.
Note that if using the Gage R&R data analysis tool for the study in Example 1, the process is the same, except that we insert A3:C19 in the Input Range and choose the Standard Format option (we don’t need to insert any number in the Number of Rows per Sample field).
Examples Workbook
Click here to download the Excel workbook with the examples described on this webpage.
References
Ramana, P. V. (2016) Gage Repeatability and Reproducibility (R&R)
No longer available online
Minitab (2020) Example of Crossed Gage R&R study
https://support.minitab.com/en-us/minitab/19/help-and-how-to/quality-and-process-improvement/measurement-system-analysis/how-to/gage-study/crossed-gage-r-r-study/before-you-start/example/
Minitab (2010) Gage studies for continuous data, fuel injector nozzle diameters
https://www.minitab.com/content/dam/www/en/uploadedfiles/documents/sample-materials/FuelInjectorNozzles-EN.pdf
Muelaner, J. (2015) Gage Repeatability and Reproducibility (Gage R&R) in an Excel spreadsheet
http://www.muelaner.com/quality-assurance/gage-r-and-r-excel/
Sloop, R. (2009) Understand Gage R&R, Quality Magazine
http://www.qualitymag.com/articles/86819-understand-gage-r-r


Hello,
Thank you for the excellent job on creating this tool!
I have a small remark as I think the Gage R&R (w/o interaction) may need a minor correction.
I used this tool and compared the results with the example from Bosch Booklet 10 which is the same example on MSA Reference Manual 4th Edition. I noticed that to come to the same results I have to modify some formulas created by the script you provide.
The example need Gage R&R (w/o interaction) and in this case the Repeatability is correctly recalculated by the ANOVA analysis from your tool. However on the below results of Gage R&R the formula for the “Operator” and the formula for “Part-to-part” are calculated pulling data from the “Operator*Part” cell instead the newly calculated “Repeatability” cell.
Bosch Booklet 10 (example from page 48) available here: https://assets.bosch.com/media/global/bosch_group/purchasing_and_logistics/information_for_business_partners/downloads/quality_docs/general_regulations/bosch_publications/booklet-no10-capability-of-measurement-and-test-processes_en.pdf
MSA Reference Manual 4th Edition (example from page 123), available here:
https://www.academia.edu/35319162/MSA_Reference_Manual_4th_Edition
Hello Paco,
Thank you for your comment.
You provide two references, and state that Real Statistics needs to be modified to be consistent with these references.
On this Real Statistics webpage I give five references.
Does the approach provided by Real Statistics follow the approach in these 5 references (or some of the 5 references)?
If so, this would imply that there are multiple ways to do Gage R&R and so perhaps I should add the approaches in your 2 references.
If your references are consistent with the 5 references that I have provided, then this would imply that the Real Statistics approach needs to be modified.
Charles