Introduction
We now show how to perform post-hoc testing using Tukey’s HSD for two-factor ANOVA. This means that we will assume that we are dealing with a balanced model.
As described in Tukey HSD for One-way ANOVA (see Unplanned Comparisons) two means are significantly different if
where the critical values qcrit are presented in the Studentized Range q Table based on the values of α, k (the number of groups), n (the number of elements in each group), and dfW.
Data Analysis Tool
Real Statistics Data Analysis Tool: We will use the Real Statistics Two Factor ANOVA with Replications Follow-up data analysis tool to perform the various analyses described on this webpage.
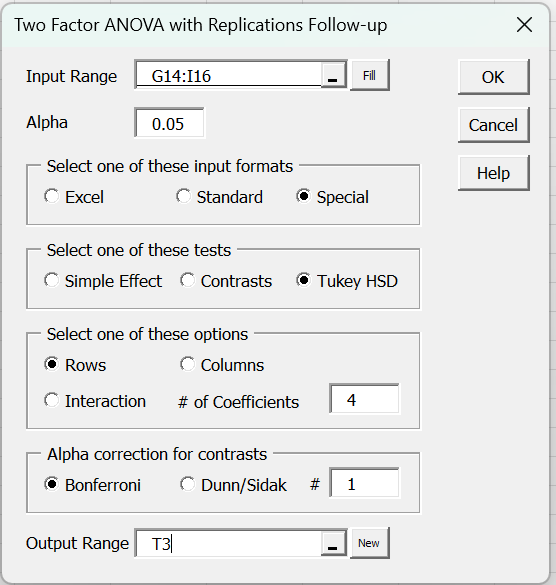
This is done by pressing Ctrl-m and selecting the Two Factor ANOVA with Replications Follow-up option from the Anova tab. You now fill in the dialog box that appears as shown in Figure 1, selecting the Tukey HSD option, as explained in Two Factor ANOVA Contrasts.
Figure 1 – Tukey HSD for two-factor ANOVA dialog box
Main Effects
For the main effects, the test is similar to the test used for one-factor ANOVA.
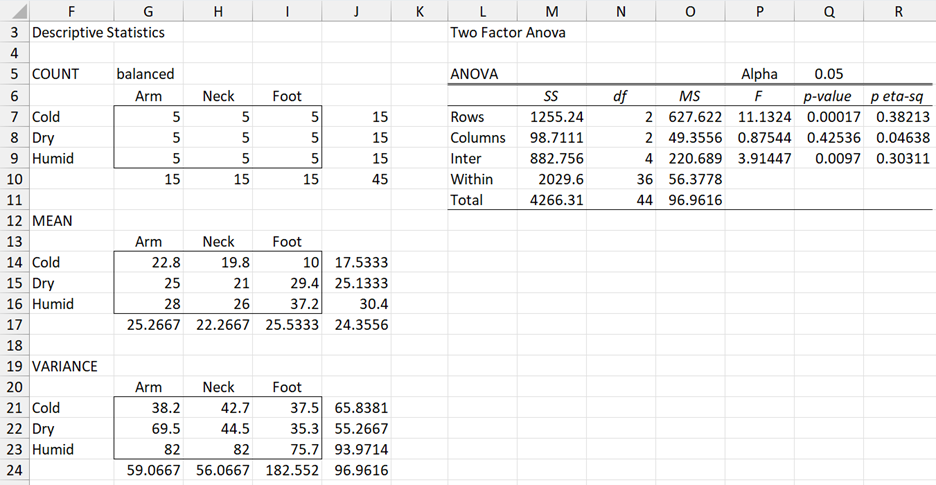
Example 1: Using the data in Example 1 of Single Factor Follow-up to Two Factor ANOVA (the analysis is replicated in Figure 2 below) determine whether there is a significant difference between the number of mosquito bites in cold and dry climates.
Figure 2 − Two Factor ANOVA
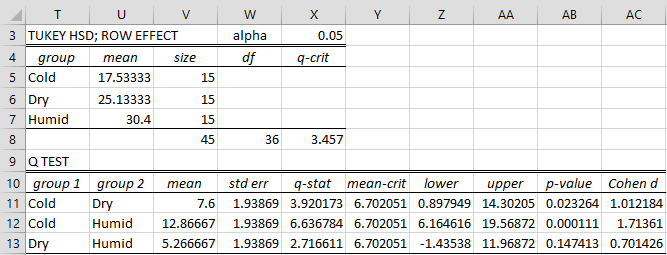
Fill in the Two factor ANOVA with Replications Follow-up dialog box, as shown in Figure 1. The output is shown in Figure 3.
Figure 3 – Tukey’s HSD for main effects
Any differences between means that exceed 6.702 (cell X11) are significant (for α = .05). Thus, there is a significant difference between Cold and Dry as well as between Cold and Humid. There is no significant difference between Dry and Humid.
Representative formulas
Key formulas from Figure 3 are described in Figure 4 (with some references to Figure 2).
| Cells | Entity | Formula |
| V5 | mean of x1 | =J14 |
| W5 | n1 | =J7 |
| V8 | n | =SUM(V5:V7) |
| W8 | df | =V8-COUNT(G7:I9) |
| X8 | q-crit | =QCRIT(COUNT(V5:V7),W8,X3,2) |
| V11 | diff of means | =ABS(U5-U6) |
| W11 | std error | =SQRT(SUMPRODUCT(G21:I23*(G7:I9-1))/(HARMEAN(V5,V6)*W8)) |
| X11 | q-stat | =V11/W11 |
| Y11 | mean-crit | =X$8*W11 |
| Z11 | lower | =V11-Y11 |
| AA11 | upper | =V11+Y11 |
| AB11 | p-value | =QDIST(X11,COUNT(V$5:V$7),W$8) |
| AC11 | Cohen d | =V11/(SQRT(HARMEAN(V5,V6))*W11) |
Figure 4 – Key formulas from Figure 3
Note that since no significant effect was detected for the Body Location factor in the Two Factor ANOVA, there is no point in performing a similar follow-up analysis for the Body Location main effect.
Interaction Effects
We now turn our attention to analyzing interaction effects.
Figure 5 – Tukey’s HSD test for interaction effects
As we discussed in Contrasts for Two Factor ANOVA, there are two types of interaction comparisons: confounded and unconfounded. Cold-Neck (cell V27) vs. Humid-Foot (cell W29) is an example of a confounded comparison; even if there is a significant difference, we can’t tell whether this is due to a difference in the climate or a difference in the part of the body which the mosquitos bit. Confounded comparisons differ in both factors. We won’t try to analyze these.
Unconfounded comparisons differ in only one factor. Such comparisons are found in the same row or the same column of range U27:W29. The comparison between Cold-Arm (cell U27) and Cold-Foot (W27) is an example of an unconfounded comparison. These are the types of comparisons that we will analyze.
Unconfounded comparisons
Of the C(9,2) = 36 possible comparisons, C(3,2) ∙ 6 = 18 of them are unconfounded. In general, if there are a levels for the Row factor and b levels for the Column factor then of the C(ab,2) possible comparisons there are C(a,2) ∙ b + C(b,2) ∙ a = ab(a + b – 2) / 2 unconfounded comparisons.
As for the main effects, two interaction means have a significant difference provided
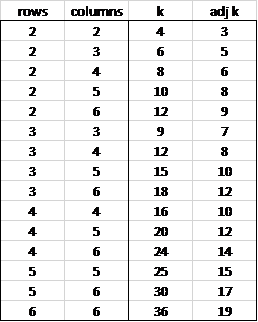
where qcrit is based on the values of α, k, and dfW. This time, we need to adjust k based on the number of possible unconfounded comparisons. For the test described in Figure 5, we saw that k = 3 ∙ 3 = 9 corresponds to 18 unconfounded comparisons. Thus, we seek the value k′ such that C(k′,2) = 18. Now, C(6,2) = 15 and C(7,2) = 21, and so we use k′ = 7 as the adjusted value of k (i.e. the closest integer value, and the higher in case of a tie).
In general, the adjusted value of k can be found in the following table. If the number of rows is greater than the number of columns then just reverse the roles of rows and columns.
Figure 6 – Adjusted k values
Worksheet Function
Real Statistics Function: The Real Statistics Resource Pack provides the following function.
ADJK(r, c) = adjusted value of k based on r rows and c columns.
Interaction Example
Example 2: Using the data in Example 1, determine whether there is a significant difference in the number of bites on the foot between people who live in cold and dry climates.
The approach used is similar to that employed for Example 1 except that now we use the adjusted k value of 7 (for a 3 × 3 contingency table as shown in Figure 6). From Figure 7, we see that there is a significant difference between the means when this difference is larger than 14.82181 (cell AC42).
Figure 7 – Tukey’s HSD test for Example 2
We see there is a significant difference (19.4 > 14.82181). In fact, we can see that the only unconfounded comparisons that yield a significant difference are Cold-Foot vs. Dry-Foot and Cold-Foot vs. Humid-Foot.
Representative formulas
Figure 8 shows some of the formulas used in Figure 7 (with some references to the cells in Figure 2). The first two entries are array formulas.
| Cells | Entity | Formula |
| Y37 | Dry | =INDEX(T37:T39,MIN(IF(U37:W39=1,ROW(U37:W39)-ROW(U37)+1))) |
| Z37 | Foot | =INDEX(U36:W36,MIN(IF(U37:W39=1,COLUMN(U37:W39)-COLUMN(U37)+1))) |
| AA37 | group mean | =INDEX(G14:I16,MATCH(Y37,F14:F16),MATCH(Z37,G13:I13,0)) |
| AB37 | group count | =INDEX(G7:I9,MATCH(Y37,F7:F9),MATCH(Z37,G6:I6,0)) |
| AA39 | mean difference | =AA37-AA38 |
| AB39 | n | =HARMEAN(AB37,AB38) |
| AC39 | k | =COUNT(G7:I9) |
| AD39 | adj k | =ADJK(COUNT(G7:G9),COUNT(G7:I7)) |
| Y42 | std error | =SQRT(SUMPRODUCT(G21:I23*(G7:I9-1))/(AB39*AA42)) |
| Z42 | q-stat | =AA39/Y42 |
| AA42 | df | =SUM(G7:I9)-COUNT(G7:I9) |
| AB42 | q-crit | =QCRIT(AD39,AA42,AG40,2) |
| AC42 | x-crit | =Y42*AB42 |
| AD42 | lower | =AA39-Y42*AB42 |
| AE42 | upper | =AA39+Y42*AB42 |
| AF42 | p-value | =QDIST(ABS(Z42),AD39,AA42) |
| AG42 | Cohen d | =ABS(AA39)/(Y42*SQRT(AB39)) |
| AH42 | effect r | =SQRT(Z42^2/(Z42^2+AA42)) |
Figure 8 – Key formulas from Figure 7
Examples Workbook
Click here to download the Excel workbook with the examples described on this webpage.
References
Howell, D. C. (2010) Statistical methods for psychology (7th ed.). Wadsworth, Cengage Learning.
https://labs.la.utexas.edu/gilden/files/2016/05/Statistics-Text.pdf
Rosenholtz, R. (2004) Two-way ANOVA, II
https://dspace.mit.edu/bitstream/handle/1721.1/111990/9-07-spring-2004/contents/lecture-notes/21_anova4.pdf


Hi there- I’ve been getting a lot of use out of these excel add-ons, a wonderful product.
However when trying to use the Tukey HSD for two factor follow-up, I’m getting negative p-values.Clearly an issue but I’m having a hard time trouble-shooting.
Any assistance would be very appreciated!
Hi M Harvey,
What is the negative p-value that you have received?
I ask since Excel reports values in scientific notation such as -1.2E-12. Although this number is negative, namely -.000000000012, it is a very small value that should be treated as zero.
If it a bigger value, then please email your data and test results so that I can figure out what has gone wrong and how to fix it.
Charles
Thank you for the wonderful software. It has been very helpful for my projects. However, in the recent project while I was doing Tukey HSD followed by two factor ANOVA test for the first time, I have gotten a few negative p-values. Just wonder if you help me out?
Hello Fiona,
Glad I could help with your projects.
Can you give me an example of a negative value that you received?
Charles
Hi there,
many thanks for the add-in package.
Just a question regarding the follow up “interaction”. my data set gave me both significant effects of columns (LD-HD) and rows (8HRS-12HRS-24HRS) but once I select the interaction analysis, I’ve got a blank table and the values compared are the same (e.g. (8 hours-LD) (8 hours-LD)) which obviously results in a p-value of 1. How can I solve this?
Many thanks
Hi Maria,
If you email me an Excel file with your data and results, I will try to figure out what is happening.
Charles
I have the same issue with Maria. What should I do?
Hi Melissa,
If you email me an Excel file with your data and results, I will try to figure out what is happening.
Charles
I try to calculate the Tukey test on my data table after runing mixed model two way anova but an error message keep displaying ”Group count range must only contain positive integer values.” Can you have me to figure out the problem?
Here is my data table https://drive.google.com/file/d/17Okpr2uciNAg-92TGZtI2l3wTzv-PW19/view?usp=sharing
Khoa,
What range did you insert in the Input Range field?
Charles
I have inputed B14:O18 in the sheet2
Khoa,
I don’t know what the problem is. When I try the Tukey Test on my computer using your data, I don’t get this error message.
Charles
Dear Mr. Zaiontz,
Let me first thank you for your excel statistics package, an absolute “must-have” add-in if you ask me.
Do you think a Tuckey analysis would be recommendable to discriminate which operators generate mismatching measurements when compared with one another in a Gage R&R set-up and also to perform unconfounded comparisons of operator-part combinations? Are there any pitfalls you can foresee to this approach?
https://real-statistics.com/two-way-anova/gage-rr/
Enric,
Glad that you are getting value from the Real Statistics software. Tell your friends.
You should be able to use Tukey’s HSD for pairwise comparisons of Operator, Part and Operator x Part. These are simply normal post hoc ANOVA approaches.
Charles
yes, i refering to Jane’s comment and the topic is “Tukey HSD after Two Factor ANOVA”
in your link there isn’t any refer to Tukey HSD
Luca,
At the bottom of the webpage that I referenced, there is a section called “More detailed within-subjects analysis”. It recommends performing a simpler repeated measures ANOVA as a follow-up test. More details about this test can be found at https://real-statistics.com/anova-repeated-measures/one-within-subjects-factor/
including using Tukey’s HSD.
Charles
https://real-statistics.com/anova-repeated-measures/one-between-subjects-factor-and-one-within-subjects-factor/
Charles
Hi Mr Zaiontz,
I am having difficulty running a follow-up two way anova, a Tukey test, as when I enter the data as in figure 1, an error message displays ”Group count range must only contain positive integer values.” I have decimal number as data, I am not sure to understand what to do. I am therefore not able to get an output table/analysis.
Do you know what could be the problem?
Thank you for your help and your toolkit,
Jean
Jean,
The data can contain decimal values, but counts are always non-negative integers.
If you send me an Excel file with your data and the analysis that you have run, I will try to figure out where the problem is.
Charles
I have the same issue and all my values are positive
Kathy,
If you send me an Excel file with your data and the analysis that you have run, I will try to figure out where the problem is.
Please make sure that your Input Range is as described on the website.
Charles
I’ve a similar error:
Group Variance range must only contain non-negative values
i used two factor ANOVA and then two factor ANOVA follow-up, but it was a reapeated measure and row is one for sample, so variance Group has no value.
Luca,
You say that you have a similar error. Are you referring to Jean’s comment or someone else?
In any case, the approach described on this webpage does not apply directly repeated measures ANOVA. See the following webpage:
https://real-statistics.com/anova-repeated-measures/one-between-subjects-factor-and-one-within-subjects-factor/
Charles
Dear Charles
I am training to run a Two way anova with replication follow up analysis using Tukey option, but I get an error message related to input data. I would appreciate your tips on this issue. The previous two way anova run fine
Thanks
Jorge Camacho
Dear Jorge,
Did you fill in the contrasts in the output (with one +1 and one -1)?
Charles
Dear Charles, thank you, it work fine
Best regards
Jorge
Sir,
Regarding the follow-up analyses for two factor Anova. Which one is the best between contrast and Tukey HSD?
What is the meaning of balanced model?
Fahmi,
See my previous response regarding your first question.
A balanced model simply means that all the group samples have the same number of elements.
Charles
Hello, I am new to Excel’s Real Statistics package and trying to perform the Tukey HSD following my two factor ANOVA- however, when I select the range for the means as input for the Tukey, the output is full of divide by zero errors, and I am not sure why this would happen. Any insight you have is greatly appreciated! Thank you!
Morgan,
You need to fill in the c column in the output, by placing a +1 in any one of the highlighted cells and a -1 in another (these are the contrast coefficients). You may compare any pair of groups without inflating the experimentwise error (which is the point of Tukey HSD).
Charles
Ah thank you, I must have scanned over that in the text.
Morgan