Simple Example
Example 1: Determine whether there are any pairwise significant difference between the blends for Example 1 of Contrasts for Two Factor ANOVA w/o Replications.
We use the Tukey HSD test to accomplish this. We use the Two Factor ANOVA Follow-up without Replications data analysis tool as described for Example 1 of Contrasts for Two Factor ANOVA w/o Replications. This time we select the Tukey HSD option in the dialog box shown in Figure 1 of Contrasts for Two Factor ANOVA w/o Replications. The result is shown in Figure 1.
Figure 1 – Tukey’s HSD for Rows factor
We see that only the BlendX vs. BlendZ comparison is significant.
Key formulas used in Figure 1 are shown in Figure 2.
| Cells | Entity | Formula |
| G2:J6 | transpose | =TRANSPOSE(A3:E6) |
| M4 | BlendX mean | =AVERAGE(H3:H6) |
| N7 | std error | =SQRT(MSWF(H3:J6,1)/COUNT(H3:H6)) |
| O7 | df | =dfWF(H3:J6,1) |
| P7 | q-crit | =QCRIT(COUNT(M4:M6),O7,S8,2) |
| Q7 | mean-crit | =N7*P7 |
| N10 | means diff | =ABS(M4-M5) |
| O10 | q-stat | =N10/N$7 |
| P10 | lower CI | =N10-Q$7 |
| Q10 | upper CI | =N10+Q$7 |
| R10 | p-value | =QDIST(O10,COUNT(M$4:M$6),O$7) |
| S10 | Cohen d | =O10/SQRT(COUNT(H$3:H$6)) |
Figure 2 – Representative formulas from Figure 1
Observation: For this version of Tukey’s HSD we assume that there is homogeneity of variance between the rows and so the value in cell N7 is a reasonable estimate of each row’s standard error.
Modified Version
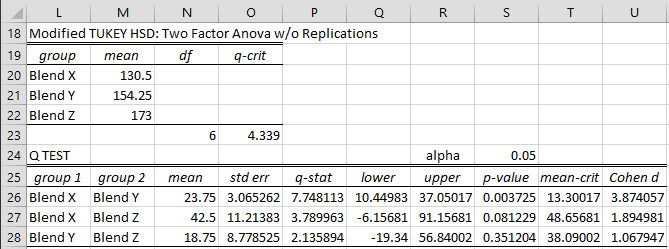
When we have reason to believe that this is not true, we can use the Modified Tukey HSD option in the dialog box in Figure 1 of Contrasts for Two Factor ANOVA w/o Replications. In this case, we obtain the results shown in Figure 3.
Figure 3 – Modified Tukey’s HSD on Rows factor
We can see from range O26:O28 that there is a difference between the standard errors on the pairwise mean differences and that the BlendX vs. BlendZ comparison is not significant, but the BlendX vs. BlendY comparison is significant.
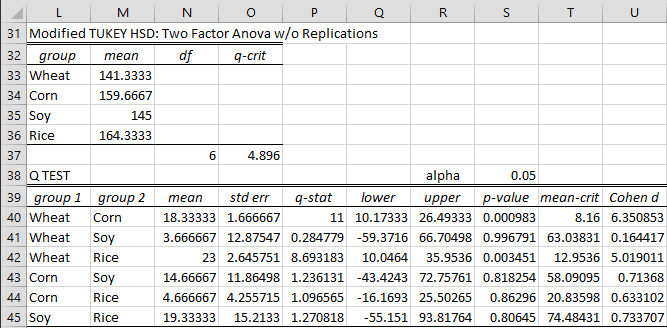
Observation: We could also perform pairwise comparisons for the Columns factor by selecting the Tukey HSD and Columns options in Figure 1. Not surprisingly, none of the six pairwise comparisons is significant, however, this is not the case when we perform the Modified Tukey’s HSD test, as shown in Figure 4.
Figure 4 – Modified Tukey’s HSD on the Columns factor
This time, we see that the Wheat vs Corn and Wheat vs. Rice comparisons are significant.
Most of the formulas used in Figures 3 and 4 are similar to those used in Figure 1. The calculation of the standard error of the mean differences is the main exception. For example, the formula used in cell O40 is the array formula =STDERR(B4:B6-C4:C6).
Examples Workbook
Click here to download the Excel workbook with the examples described on this webpage.
Reference
Howell, D. C. (2010) Statistical methods for psychology (7th ed.). Wadsworth, Cengage Learning.
https://labs.la.utexas.edu/gilden/files/2016/05/Statistics-Text.pdf


Hi Charles. Firstly – thank you so much for this website! It helps me a lot with the PhD journey.
If you don’t mind – I have a question with my data set.
I have 2 factors – Process Type (2 types) and Biomass Type (5 types). So I’ve got 10 observations (without replication).
Step 1. I performed Two-way ANOVA without replication and have p-value of Process Type effect and of Biomass Type effect.
Step 2. I want to determine whether the interaction effect is significant – so I have to perform Tukey’s Additivity Test.
Step 3. I want to perform Tukey HSD test to observe the differences between groups.
Is my approach accurate? Or maybe I shouldn’t perform Step 2 and Step 3 both? What do you think?
It seems like your three step approach is correct.
Charles
hello Charles,
I want to know about the statistical significance that was determined using a two-way ANOVA with Tukey’s multiple comparisons test. I looked it up and couldn’t find it. What should I refer to? Thanks a lot.
Hello,
Perhaps the following webpage is what you are looking for
https://www.real-statistics.com/two-way-anova/follow-up-analyses-for-two-factor-anova/
Charles
Thank you so much. I’ll try it.
liqing
Hi Charles,
I have successfully added xrealstats as an Add-In in my Excel but somehow I dont see the option for the Two Factor Anova without Replications Follow Up. I also tried restarting my laptop but still the same. I made sure some add ins are checked: like the Solver. I have Analysis ToolPak and Analysis Toolpak -VBA checked as well. Not sure how to troubleshoot this more. Hoping for your kind help. Thank you!
Hi Tricia,
The option is called Follow-up Two Factor Anova w/o Repl.
If you don’t see it, then perhaps you are using an old version of the software. What do you see when you enter the formula =VER() in any cell?
Charles
Dear Charles,
Thank you again. The link provided found very useful for troubleshooting.
Thanks
Arvind
Hello Charles,
I have calculated standard error for Modified Tukey HSD : Two factor ANOVA w/o replications of above example in Excel. (Blend X – Blend Y). But I got Std Error value as 11.2537 instead of 3.0652.
Blend X Blend Y
123 145
138 165
110 140
151 167
Std-15.4353 11.9032
SEm-8.9116 6.8723
SEm2-79.4166 47.2291
SE 11.2537
What is wrong with me?
—Arvind.
Hello Arvind,
It appears that you ran a two-sample t-test. This is not the same thing as the modified Tukey HSD test and doesn’t correct for experimentwise error.
I just redid the Real Statistics data analysis tool and confirm that s.e. = 3.0652.
Charles
Dear Charles,
Thanks for your reply. How can I calculate the Std Err using Excel.
Whenever I start my computer every time I have to go to Add inns to add Real Statistic tool pack. So I want to use it in excel.
Arvind
Dear Arvind,
Perhaps you can copy the approached used to calculate the std err that is used in the output from the Real Statistics add-in.
You should need to add the Real Statistics add-in each time you start your computer. What release of Windows or the Mac are you using? What release of Real Statistics are you using? You can use the =VER() formula to find this out. Also, see the Troubleshooting secton of
https://www.real-statistics.com/free-download/real-statistics-resource-pack/
Charles