Basic Concepts
Aligned Rank Transform (ART) ANOVA is a non-parametric approach to factorial ANOVA that enables you to analyze the interaction as well as the main effects. As usual, ranked data is used, but first, the data for each effect (main or interaction) must be aligned before ranks are calculated.
This approach is useful when the data is not normally distributed. It can be used when the homogeneity of variances assumption is violated, although there is a risk of an inflated alpha value (alpha is up to about .07 when set to .05 for the interaction effect and up to .09 for the main effects.
Two-Factor ART ANOVA
When we have two factors (row and column), we assume that the data can be represented as xijk where i represents the rows, j represents the columns and k represents replications. Let x̄ij = the average of {xijk: k}, x̄i. = the average of {xijk: j, k}, x̄.j = the average of {xijk: j, k} and x̄ = the average of {xijk: i, j, k}.
For the rows factor, we adjust each data element as follows:
![]()
Similarly, for the columns factor, we adjust each data element as follows:
![]()
For the interaction of the factors, we adjust each data element as follows:
![]()
Now we conduct three separate ANOVA analyses, one for the rows main effect, one for the columns main effect, and a third for the interaction effect. The data for these are the ranked values of the x’ijk.
Example
Example 1: Conduct ART ANOVA for the data in range A3:C21 of Figure 1.
This a fairly simplistic two-fixed factor example where the response variable takes Likert values 1 through 5. Figure 1 shows the results from an ordinary two-factor ANOVA using the Real Statistics Two Factor ANOVA data analysis tool on the input data in range A3:C21 in standard format.
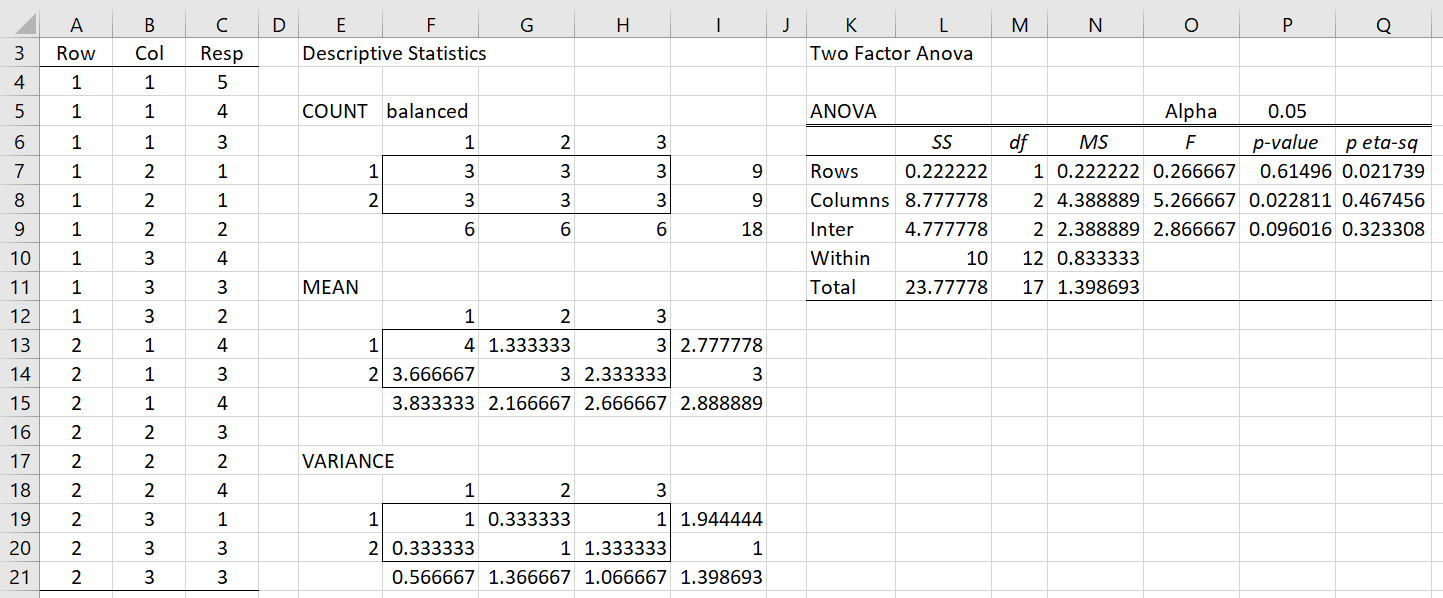
Figure 1 – Two Factor ANOVA
Calculating Aligned Values
Since we are using Likert data, it is likely that the normality assumption is violated and so we will use ART ANOVA. We begin by calculating the aligned values, as shown in Figure 2.
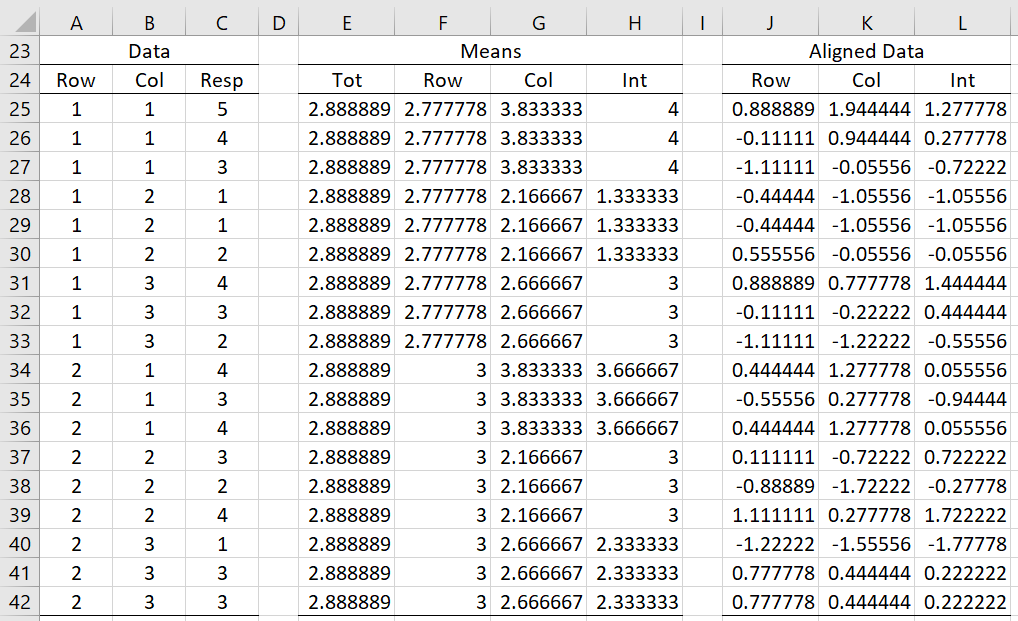
Figure 2 – Aligned Data
First, we calculate the means x̄ij, x̄i., x̄.j, x̄ in columns E through H. Here we place the formula
=AVERAGE($C$25:$C$42) in cell E25
=AVERAGEIF($A$25:$A$42,A25,$C$25:$C$42) in cell F25
=AVERAGEIF($B$25:$B$42,B25,$C$25:$C$42) in cell G25
=AVERAGEIFS($C$25:$C$42,$A$25:$A$42,A25,$B$25:$B$42,B25) in cell H25.
We then highlight the range E25:H42 and press Ctrl-D.
Alternatively, we could place the worksheet formula =$I$15 in cell E25, the worksheet formula =INDEX($I$13:$I$14,MATCH(A25,$E$13:$E$14),1) in cell F25, the formula =INDEX($F$15:$H$15,1,MATCH(B25,$F$12:$H$12)) in cell G25 and the Real Statistics formula =MLookup($E$12:$H$14,A25,B25) in cell H25. We then highlight the range E25:H42 and press Ctrl-D.
The aligned data in columns J, K, and L are calculated as follows. Place =C25-H25+F25-E25 in cell J25, =C25-H25+G25-E25 in cell K25 and =C25-F25-G25+E25 in cell L25. We then highlight the range J25:L42 and press Ctrl-D.
Row Factor Analysis
We now conduct three separate two-factor ANOVA analyses on the ranks of each of the aligned data values. For the row factor, this analysis is shown in Figure 3.
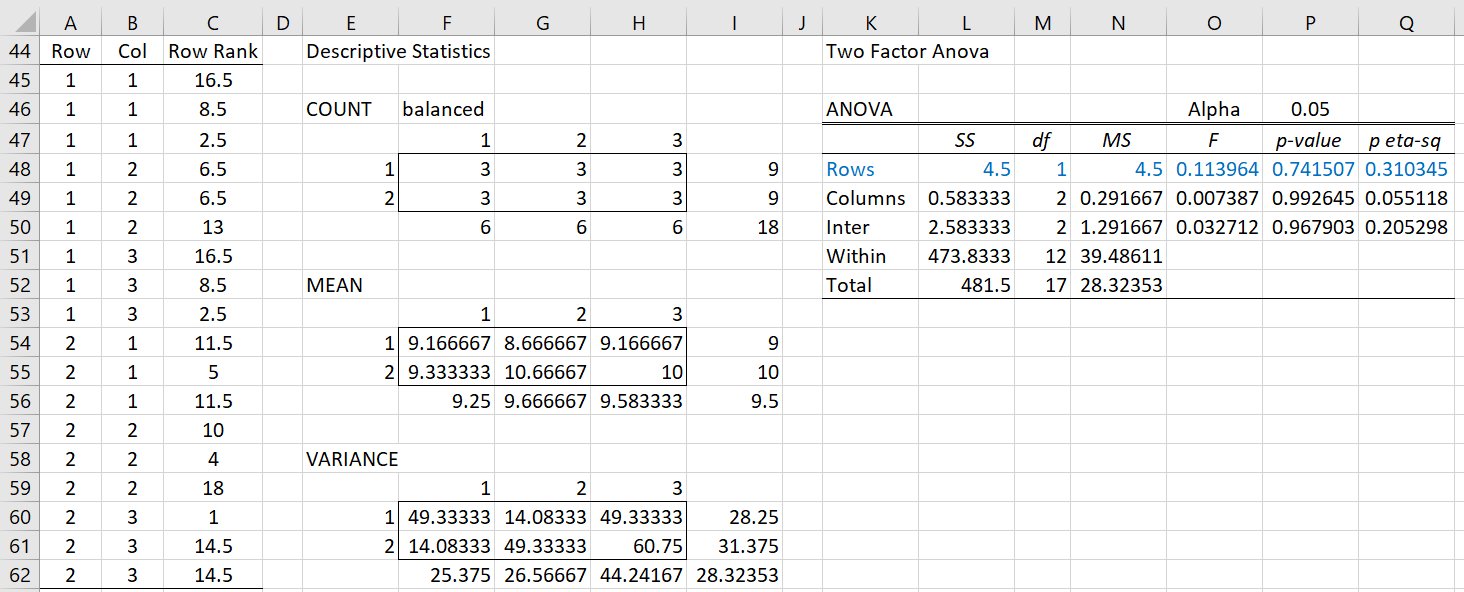
Figure 3 – ART ANOVA for Row Factor
Here cell C45 contains the formula =RANK_AVG(J25,J$25:J$42,1). To fill in the other ranked values, we highlight range C45:C62 and press Ctrl-D. We then use the Real Statistics Two Factor ANOVA data analysis tool on the input data in range A44:C62 in standard format. We ignore all the output with the exception of the results in range K48:Q48 (in blue).
Interaction Factor Analysis
We now repeat this approach for the column and interaction factors. The results for the interaction of the row and column factors are shown in Figure 4.
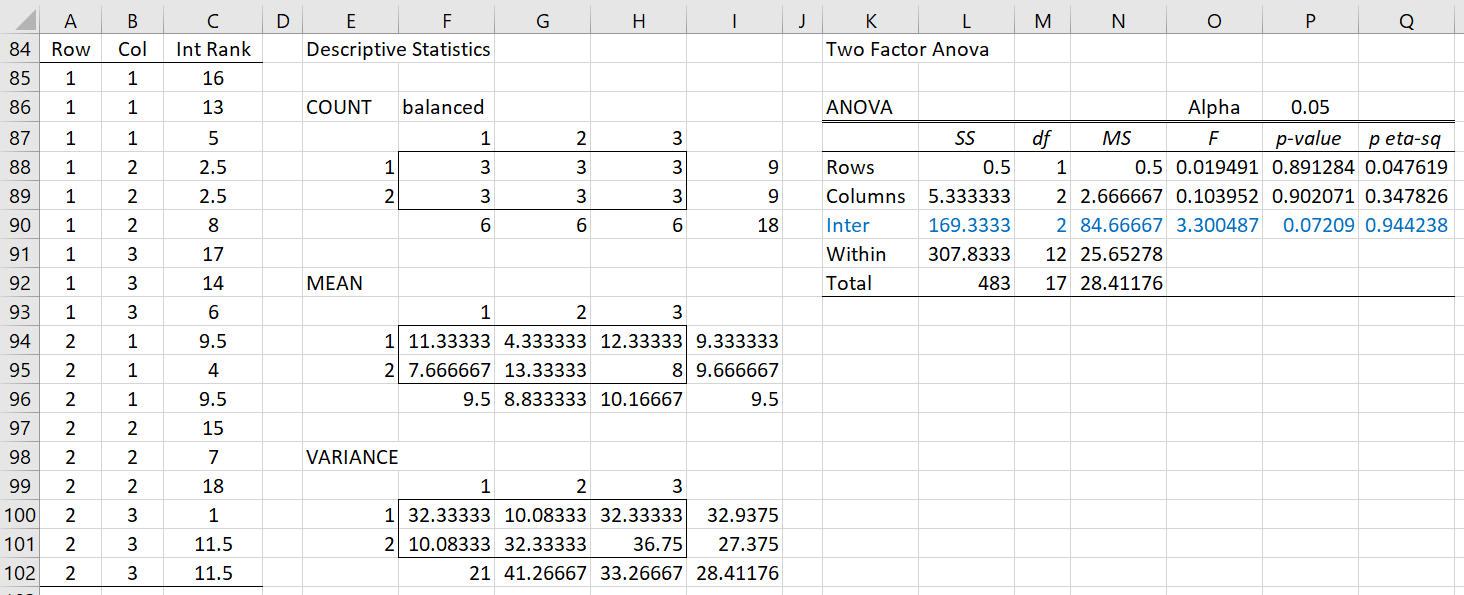
Figure 4 – ART ANOVA for the Interaction
This time, we place the formula =RANK_AVG(L25,L$25:L$42,1) in cell C85, highlight range C85:C102, and press Ctrl-D. Using the Real Statistics Two Factor ANOVA data analysis tool on the input data in range A84:C102 in standard format, we obtain the output shown on the right side of Figure 4, ignoring everything with the exception of the results in range K90:Q90 (in blue).
ART ANOVA Results
We summarize the results from the three ANOVAs in Figure 5.
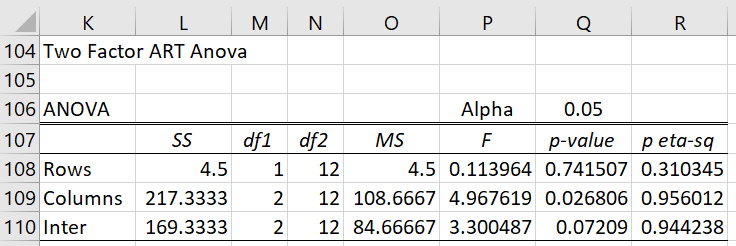
Figure 5 – Two Factor ART ANOVA
We see that the columns main factor is significant, while the rows and interaction are not.
Note that the output in this figure can be achieved via the formulas shown in Figure 6.
| Cell | Entity | Formula |
| L108 | SS Rows | =SSRowStd(E4:G21) |
| L109 | SS Cols | =SSColStd(MERGE(E4:F21,H4:H21)) |
| L110 | SS Inter | =SSIntStd(MERGE(E4:F21,I4:I21)) |
| M108 | df Rows | =dfRowStd(E4:G21) |
| M109 | df Cols | =dfColStd(MERGE(E4:F21,H4:H21)) |
| M110 | df Inter | =dfIntStd(MERGE(E4:F21,I4:I21)) |
| N108, N109, N110 | df Within | =dfWFStd(E4:G21) |
| O108 | MS Rows | =L108/M108 |
| P108 | F Rows | =O7/(SSWFStd(E4:G21)/N7) |
| P109 | F Cols | =O8/(SSWFStd(MERGE(E4:F21,H4:H21))/N8) |
| Q108 | p-value Rows | =F.DIST.RT(P7,M7,N7) |
| R108 | Partial eta-sq Rows | =P7*M7/(N7+P7*M7) |
Figure 6 – Key Formulas from Figure 5
Examples Workbook
Click here to download the Excel workbook with the examples described on this webpage.
References
Wobbrock, J. O., Findlater, L., Gergle, D., Higgins, J. J. (2011) The Aligned Rank Transform for Nonparametric Factorial Analyses Using Only ANOVA Procedures. Conference: Proceedings of the International Conference on Human Factors in Computing Systems, CHI 2011, Vancouver, BC, Canada
https://faculty.washington.edu/wobbrock/pubs/chi-11.06.pdf
Leys, C. and Schumann, S. (2010) A nonparametric method to analyze interactions: The adjusted rank transform test
http://cescup.ulb.be/wp-content/uploads/2015/04/Leys_and_Schumann_nonparametric_interactions.pdf
Hi Charles,
Thanks for such a dedication and make statistics a bit easier for us 🙂
I have a simple question, what can be the best approach to compare differences between time points (3 time points) within each group (3 groups) if a significant interaction (time * group) is found using mixed model ANOVA with ART data? I am not sure that is covered in real-statistics and how to handle it.
Thanks a lot.
Hi Diego,
Glad that you find Real Statistics useful for you. I try to make statistics clearer and easier to learn.
Sorry, but I am not familiar with the model that you have described.
Charles
Hi Charles,
I have found open the first reference in this link: https://faculty.washington.edu/wobbrock/pubs/chi-11.06.pdf
Thanks for your work!!
Laura.
Hi Laura,
Thanks for sharing this information. I have just updated the webpage with this link.
Charles
Hi Charles
thank you very much for real-stats and your continuing help for those of us who know where we need to get to but have little idea how we might get there.
I have read that the maths exists for a mixed effect ART ANOVA so it can handle repeated measures, and there is an R package which does it, however I don’t have access to R and even if I did would have no idea what to do with it. Is this possible in real stats?
Hi Jamie,
Thanks for your kind words. I don’t know of a suitable R package. I will eventually look into ART for repeated measures ANOVA.
Charles