Basic Concepts
On this webpage, we describe how to conduct aligned rank transform (ART) ANOVA with three factors.
Since we have three factors, we assume that the data can be represented as xijkh where i, j and k represent the three factors and h represents replications.
For the i factor, we adjust each data element as follows:
The adjustments are similar for the j and k factors, For the interaction of the i and j factors, we adjust each data element as follows:
The adjustments are similar for the jk and ik interactions, For the interaction of the i, j and k factors, we adjust each data element as follows:
Now we conduct seven separate ANOVA analyses, one for each effect. The data for these are the ranked values of the x′ijkh. We show how this is done for the A factor, but first, we describe the following function.
Worksheet Functions
Real Statistics Function: The Real Statistics Resource Pack supports the following array function:
Std3Art(R1, head): takes the data in R1 in standard three-factor ANOVA format (i.e. a four-column array whose first three columns consist of A, B and C factor labels and whose last column consists of the corresponding values of the dependent variable) and returns an array with ten columns, the first three columns are identical to the first three columns of R1 and the other columns are the ART ranks for the A, B, C, AB, AC, BC and ABC factors; if head = TRUE (default FALSE) then both R1 and the output contain column headings.
Example
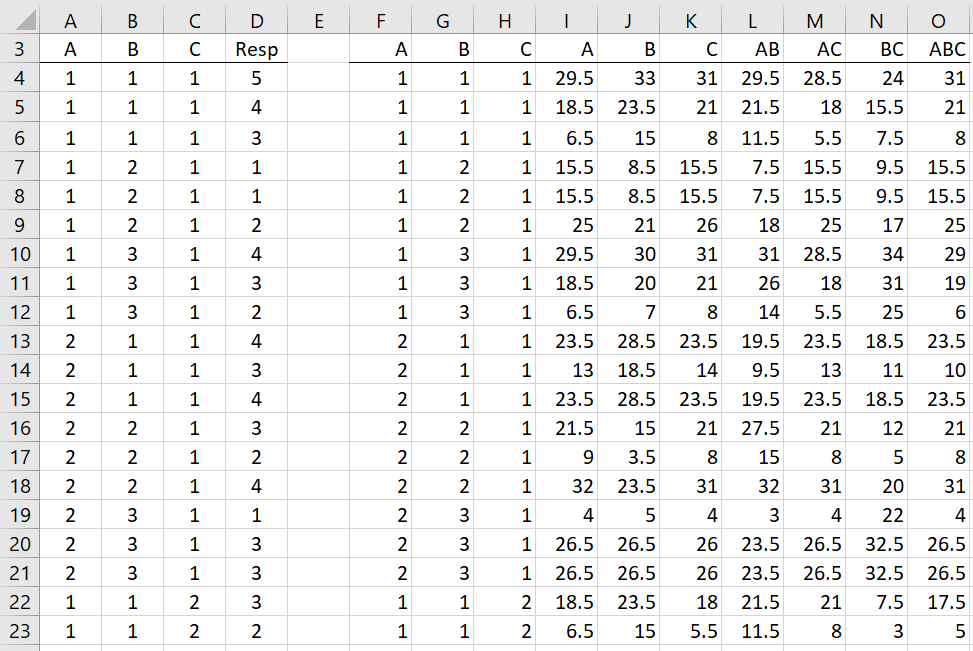
Example 1: Show how to calculate the p-value for the A factor of three-factor ART ANOVA for the data shown in columns A, B, C and D of Figure 1 (only the first 20 of 36 rows is displayed).
Figure 1 – Aligned Ranks
In this example, factors A and C have two levels and factor B has 3 levels. Range F3:O39 contains the aligned ranks as calculated by the array formula =Std3Art(A3:D39,TRUE). We now use Real Statistics’ Three-Factor ANOVA data analysis tool based on the input range F3:I39 in standard format, as shown in Figure 2.

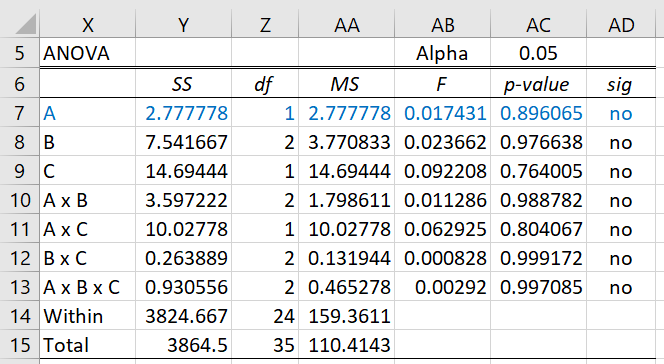
Figure 2 – Three-Factor ANOVA on ART data for factor A
We see from the figure that factor A is not significant. We can ignore all the output except that associated with factor A. Finally, we can next perform similar analyses for the other factors.
Examples Workbook
Click here to download the Excel workbook with the examples described on this webpage.
References
Wobbrock, J. O., Findlater, L., Gergle, D., Higgins, J. J. (2011) The Aligned Rank Transform for Nonparametric Factorial Analyses Using Only ANOVA Procedures. Conference: Proceedings of the International Conference on Human Factors in Computing Systems, CHI 2011, Vancouver, BC, Canada
https://faculty.washington.edu/wobbrock/pubs/chi-11.06.pdf
Leys, C. and Schumann, S. (2010) A nonparametric method to analyze interactions: The adjusted rank transform test
http://cescup.ulb.be/wp-content/uploads/2015/04/Leys_and_Schumann_nonparametric_interactions.pdf

How I can get A =29.5 , B = 33 …ABC = 5?
Hello,
These values are returned via the array formula =Std3Art(A3:D39,TRUE). This formula uses the equations in the early part of the webpage.
Charles
Thanks, i still failed to run with that formula.
Sorry, but I haven’t issued the bug-fix release yet.
Charles
I wish the ART 3 factors (3x2x3) can help me to do statistical analysis for interaction within subjects. I am still tried to find the best statistical method, due to my data is not normal distribution.
Thank you, I can do ART now. Next, I want ask you to do repeat measure ANOVA with 3 factors (factor A, C have 3 levels, and factor B has 2 levels). Your explanation in this website page said : use Real Statistics’ Three-Factor ANOVA data analysis tool based on the input range F3:I39 in standard format. Is it to get A factor figure, right? how about B, C, and interaction of AB,AC, BC, and ABC?
Hello Bene,
I don’t see these instructions on this webpage. Which webpage are you referencing?
Charles
PS I have not issued the bug fix for ART yet. Keep in mind that the existing version works for many configurations but not all.
One more thing. I found a bug in the Std3Art worksheet function. This produces an error value for example on the webpage. I expect to issue a bug fix release shortly to fix this problem.
Charles
I opened the worksheet and tried to used the formula in the new worksheet, unfortunately the formula is still not work.
hi Charles, i want to know if this problem has been resolved? it does not work
What do you see when you insert the formula =VER() in any cell?
Charles
TEST COMMENT …
Yes, I received the test comment.
Charles