Basic Concepts
We can use a modified version of the Mann-Kendall Test to determine whether there is a monotonic trend when data shows seasonality. In this case, we are testing whether the data is monotonically increasing in all seasons or monotonically decreasing in all seasons. The test will give misleading results if there is an increasing monotonic trend in some seasons and a decreasing trend in others.
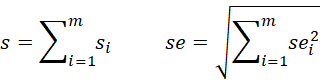
If there are m seasons and the Mann-Kendall statistic for each season i is si with standard error sei then the test statistic is s and standard error se are:
We now define
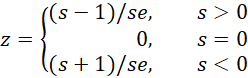
The null hypothesis is:
H0: There is no monotonic trend
If |z| >= zcrit = NORM.S.INV(1–α/2) then we reject the null hypothesis (two-tailed). There are also the usual one-tailed tests.
This approach is generally valid when there are at least 20 data points.
Example
Example 1: Determine whether the data in Figure 1 has a monotonic trend.
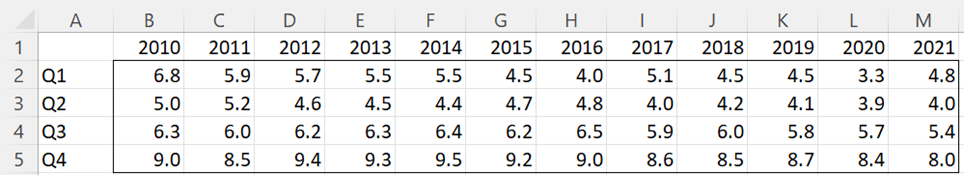
Figure 1 – Seasonal Kendall’s test data
Figure 2 displays a chart of the data in Figure 1, actually a chart of the column array resulting from RESHAPES(B2:M5,,1).
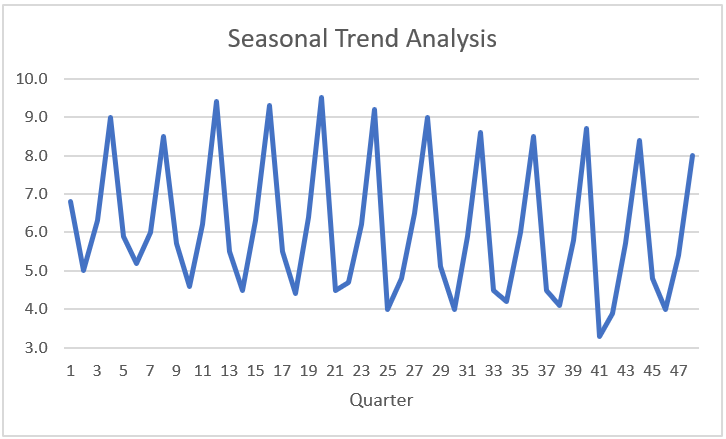
Figure 2 – Chart of the data
As you can see from the chart, there appears to be seasonality with a periodicity of 4 (quarterly). We now perform four Mann-Kendall tests, one for each quarter, as shown in Figure 3.
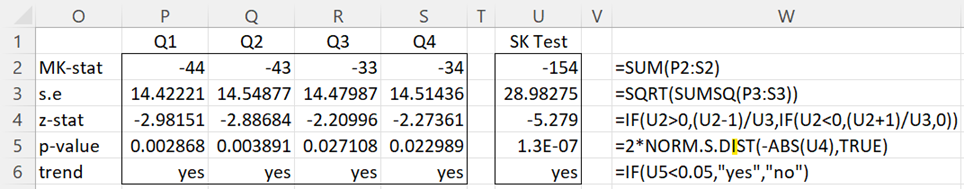
Figure 3 – Seasonal Kendall’s Test
For example, you can calculate the values shown in P2:P6 for Q1 by using the Real Statistics formula =MK_TEST(B2:M2). The resulting Seasonal Kendall’s test results are shown in U2:U6 using the formulas shown in column W.
Worksheet Function
Real Statistics Function: The Real Statistics Resource Pack supplies the following array function to automate the steps required to perform the Mann-Kendall Test.
SK_TEST(R1, per, lab, tails, alpha): returns a column array with the values s, s.e., z-stat, p-value, and trend.
R1 is a column array containing the time series values, if lab = TRUE then an extra column of labels is appended to the output (default FALSE), tails = 1 or 2 (default), and alpha is the significance level (default .05).
trend takes the values “yes” or “no” in the two-tailed test, and “upward” or “no” in the one-tailed case where s > 0 and “downward” or “no” in the one-tailed case where s < 0.
For Example 1, =SK_TEST(B2:M5,4) outputs the results shown in range U2:U6 of Figure 3. You can get the same result via the formula =SK_TEST(RESHAPES(B2:M5,,1),4).
Examples Workbook
Click here to download the Excel workbook with the examples described on this webpage.
References
Pacific Northwest National Laboratory (2023) Seasonal Kendall test for monotonic trend
https://vsp.pnnl.gov/help/Vsample/Design_Trend_Seasonal_Kendall.htm
Dennis R. Helsel, Robert M. Hirsch, Karen R. Ryberg, Stacey A. Archfield, and Edward J. Gilroy (2020) Statistical Methods in Water Resources
https://pubs.usgs.gov/tm/04/a03/tm4a3.pdf
Dear Dr Charles, How are you? I do appreciate the expertise work you are doing here. I am new to trend analysis and I have season-based data (day and night) from 2003-2022. I tried to see your seasonal example data which you have done in Excel however I am unable to do with my data. Could you please share with me some hints if I commit some errors as I can’t run it using the formulas you stated in your example? Be aware as I am working on windows
Hi Samuel,
If you email me an Excel spreadsheet with your data and Seasonal Kendall Test results, I will try to figure out what is going wrong.
Charles
Hi! I would like to know if the Seasonal Kendall’s Test work’s on a data where the months are not equally distributed over the years. For example, I have a sampling frequency of about two samples per month for each year, between 2019 and 2023. However, in 2019 there are some missing data for months #2, #3, #4, #5, #6, #7, #8 and #9 for one sampling campaign, and in the year 2023 there are missing data for both campaigns for months #10, #11 and #12. I observed the same result of an upward trend using the data with and without the missing data, even though considering the missing data the parameters were SK-stat: 131, s-e: 33,92, z-stat: 3,95 and p-value:0,007845, while without the missing data the parameters were SK-stat: 89, s-e: 33,08, z-stat: 2,66 and p-value:0,00781. Can I work with these not equally distributed data? Thank you so much for this application for Excel, it has been really good for what I studying at the moment.
Hello Elizangela,
Sorry, but I don’t know how conduct this test with missing data. You might be able to use one of the missing data techniques described at
https://real-statistics.com/handling-missing-data/
Charles