Basic Concepts
The Mann-Kendall Test is used to determine whether a time series has a monotonic upward or downward trend. It does not require that the data be normally distributed or linear. It does require that there is no autocorrelation.
The null hypothesis for this test is that there is no trend, and the alternative hypothesis is that there is a trend in the two-sided test or that there is an upward trend (or downward trend) in the one-sided test. For the time series x1, .., xn, the MK Test uses the following statistic:
Note that if S > 0 then later observations in the time series tend to be larger than those that appear earlier in the time series, while the reverse is true if S < 0.
The variance of S is given by
where t varies over the set of tied ranks and ft is the number of times (i.e. frequency) that the rank t appears.
The MK Test uses the following test statistic:
where se = the square root of var. If there is no monotonic trend (the null hypothesis), then for a time series with more than 10 elements, z ∼ N(0, 1), i.e. z has a standard normal distribution.
Examples
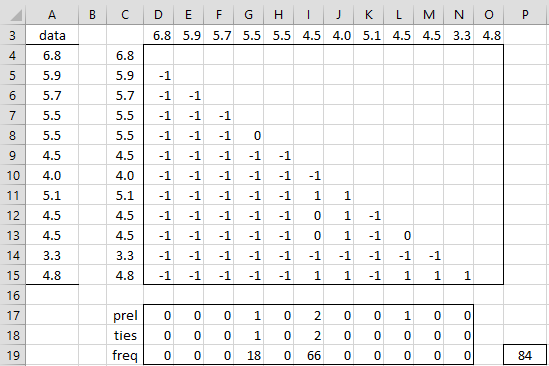
Example 1: Determine whether the time series in range A4:A15 of Figure 1 has a monotonic trend.
Figure 1 – Mann-Kendall Test (part 1)
We build a table in range D4:O15 so that the row and column headings consist of the data elements in the time series and the cells in the lower triangular part of the table consist of the values in S. In particular, we insert the following formula in cell D4, highlight range D4:O15, and press Ctrl-D and Ctrl-R.
=IF(ROW(D4)-ROW(D$4)>COLUMN(D4)-COLUMN($D4),SIGN($C4-D$3),””)
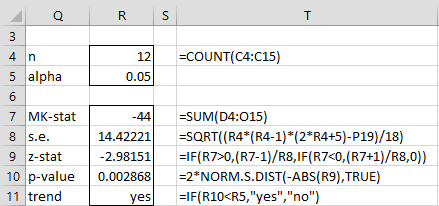
S is now the sum of the elements in this table. In fact, the MK Test, based on this table is shown in Figure 2.
Figure 2 – Mann-Kendall Test (part 2)
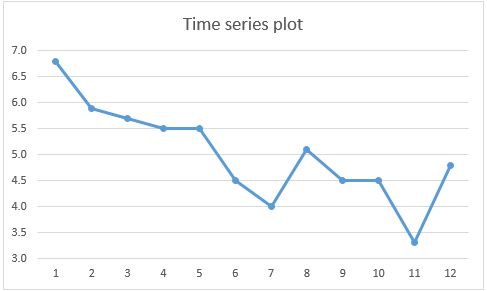
Note that S = -44 (cell R7), which indicates the potential for a downward trend. This is consistent with the line chart of the time series data shown in Figure 3.
Figure 3 – Downward trend
The analysis shown in Figure 2 confirms that there is significant evidence for the claim that the data has a trend based on a two-sided test. Actually, if we had conducted a one-sided test we would reject the null hypothesis that there is either no trend or an upward trend, and conclude that there is a downward trend (the p-value for this test is half of the value shown in cell R10).
Ties Correction
Note that the ties correction used in the formula in cell R8 is based on the value in cell P19. This is calculated based on the values shown in range D17:N19. To create the values in this range, first insert formula =COUNTIF(E3:$O3,D3) in cell D17 and then highlight range D17:N17 and press Ctrl-R. Cells in this row (labeled preliminary ties counts) that are not zero correspond to time series values that are tied. The only problem is that when the ties count is bigger than 1 (i.e. two values are tied) there is some double counting.
This double counting is eliminated in the next row (labeled ties counts). This is accomplished by inserting the formula =D17 in cell D18, the formula =IF(COUNTIF($D3:D3,E3)=0,E17,0) in cell E18, highlighting the range E18:N18 and pressing Ctrl-R. This row shows that there are 2 data elements with the value 5.5 (the column heading above cell G18) and 3 elements with the value 4.5 (the column heading above cell I18). The values shown in cells G18 and G20 are one less than the number of ties.
The following row contains the ties corrections where cell P19 contains the sum of these corrections. This is done by inserting the formula =IF(D18=0,0,D18*(D18+1)*(2*D18+7)) in cell D19, highlighting the range D19:N19, pressing Ctrl-R and, inserting the formula =SUM(D19:N19) in cell P19.
Worksheet Function
Real Statistics Function: The Real Statistics Resource Pack supplies the following array function to automate the steps required to perform the Mann-Kendall Test.
MK_TEST(R1, lab, tails, alpha): returns a column array with the values S, s.e., z-stat, p-value, and trend.
R1 is a column array containing the time series values, if lab = TRUE then an extra column of labels is appended to the output (default FALSE), tails = 1 or 2 (default), and alpha is the significance level (default .05).
trend takes the values “yes” or “no” in the two-tailed test, and “upward” or “no” in the one-tailed case where S > 0 and “downward” or “no” in the one-tailed case where S < 0.
For Example 1, =MK_TEST(A4:A15,TRUE) outputs the results shown in range Q7:R11 of Figure 2.
Data Analysis Tool
The Mann-Kendall Test can also be performed using the Trend and Change Point Tests data analysis tool, as demonstrated in Sen’s Slope.
Seasonal Test
See Seasonal Kendall’s Test for a seasonal version of the Mann-Kendall Test.
Examples Workbook
Click here to download the Excel workbook with the examples described on this webpage.
Reference
Gocic, M. and Trajkovic, S. (2012) Analysis of changes in meteorological variables using Mann-Kendall and Sen’s slope estimator statistical tests in Serbia. Elsevier
https://www.academia.edu/6955354/Trend_Analysis_MK_Sen_Slope


HI,
Will it be correct to use the one-sided test if the null Hypothesis is stated as below?
H0 : There is no upward trend in the time series
Is it always recommended to use a two-tailed test to maintain the sanctity of the results?
Hi Jayati,
Sure. You can perform such a one-sided test provided that you decide to do so before collecting data.
Charles
Hello Mr. Charles
I have a question please
When the trend in the Mann-Kendall test is positive for time series and the trends are of varying strength, for example (0.1, 0.4, and 0.8), how do I classify them in terms of trend strength, such as strong, medium, or weak? Please, I also need a reference that mentions this so that I can document it in my research work.
Finally, I am very grateful for your response
Regards, Haifa
Hello Haifa,
I don’t have any metrics that show trend strength as strong, medium, and weak.
Perhaps the following paper can help, but I am not sure since I have not read the paper.
Hamed, Exact distribution of the Mann–Kendall trend test statistic for persistent data
Charles
Thank you Mr. Charles
I will check it out.
Have a nice day, Best regards
Haifa
hello mr. Charles
I apologize in advance if my English is not good or seems impolite. I am still a beginner.
so there is something I want to discuss related to this.
I want to analyze the trend of rain data using the mann kendal method, in a certain year period there is a lot of missing rain data, is it okay if I estimate the missing rain data using the normal ratio method? will it affect the results of the mann kendal analysis? and will the rain data that has been estimated and then analyzed using mann kendal produce valid data?
Hello Nanda,
If the normal ratio method is a reliable and valid way to estimate missing data then it should be effective for Mann-Kendall, especially since it relies on data collected from nearby locations and not nearby periods in time.
I don’t have any experience using this approach though.
Charles
Can you please tell me in the experiments of Theil-Sen Median slope estimation and Mann-Kendall trend analysis, there are some points in my raster data where some of the year’s values are missing, do I need to go ahead and ignore the value of this point in the whole time series or do I have to calculate it by taking the mean or by keeping the NaN.
1. I doubt that substitute the mean for missing data will be appropriate since this would distort any trend. NaN wouldn’t work for Real Statistics. I don’t know how NaN would be handled by other statistical software packages.
2. What to do probably depends on how much missing data you have. I can think of two approaches: (1) just leave out the missing data and (2) use interpolation: see https://real-statistics.com/time-series-analysis/stochastic-processes/handling-missing-time-series-data/
3. Perhaps someone else has other ideas.
Charles
Thanks for this wonderful article! I’m still reviewing the equations for the Mann-Kendall test and am a bit confused still on tied values and how variance in my data will affect how the test determines trend. For example, if I’m looking to determine if there’s a trend in monthly or seasonal volumes of a river (i.e. calculating volume for a specific month or season for each year and then running the Mann-Kendall test), will the trend be more easily determined in months where there are lower volumes and therefore lower variance in the dataset like in the summer versus say May where flows and therefore variance is much higher during spring runoff?
Nick,
This seems to be a judgement call, and depends on which approach better captures the study you are undertaking. You can also provide multiple approaches. The most important thing is to not perform multiple tests and pick the one that confirms your preconceived hypothesis.
Charles
Hi Charles,
In the formula “=SQRT((R4*(R4-1)*(2*R4+5)-P19)/18)”, what does the 18 represent?
Thanks
Hi Todd,
I don’t think there is anything special about the number 18. It is just how the mathematics works out.
Charles
Hi Charles,
Great example – thanks!
I had a question though regarding the example shown. If the alpha is 0.05 but in the example you are performing a two sided test, should the trend formula not be comparing it against 0.025? Apologies if I’ve got this totally mixed up.
Hi Caroline,
For a one-sided test you either need to divide the p-value by two or multiply alpha by two (to .10).
Charles
Hi Charles
There is a typo in the first equation – should be “i” instead of “k”.
Otherwise, great article and great project.
Very helpful for “homemade wannabe experts in statistics” like me.
Kind regards
Valentine
Hi Valentine,
Thanks for catching this error. I have now corrected the mistake.
I appreciate your help in improving the quality of the Real Statistics website.
Charles
Hello,
I have a general question about the Mann-Kendall test. I use the SeasonalMannKendall test in R to calcualte the tau statistics and 2-sided p-value, and Thiel-San slope to evaluate long term environemtnal trends. The seasonal flavor of the test eliminates the issue of autocorrelation. There is an argument about the need to calculate the gamma statistic (see for example page 4 in https://www.sciencedirect.com/science/article/pii/S1470160X22004617?via%3Dihub. Given that Mann-Kendall is a non-parametric, ranking method, do you think this is necessary?
Hello Carlos,
Sorry, but I am not familiar with this gamma statistic, and so I am unable to address your question.
Charles
Addendum to my point 4. I only had to ‘enable editing’ and the #NAME? entries resolved!
Dear Charles,
I’m using the Mann-Kendall Sens slope routine and have a few questions/comments (got the program to load fine after troubleshooting – thanks!).
1. Is the MK Stat in the output equivalent to S?
2. How is the MK Stat related to tau?
3. How is either tau or the MK Stat related to Sen’s slope?
4. When I downloaded your example file Mann-Kendall-Test there are quite a few #NAME? entries.
5, Also, your algorithm assumes points are equidistant right? Mine are, but others might not be.
Dear Heather,
1. Yes, MK stat is equivalent to S
2. See https://stats.stackexchange.com/questions/414038/relationship-between-mann-kendall-and-kendall-tau-b
3. They have the same standard error
4. Is the Real Statistics software installed? What do you see when you enter the formula =VER() in any cell? If installed, I suggest that you close the worksheet containing the example and then reopen it.
5. I don’t believe that this is a requirement. See, for example, the following webpage concerning using the MK test with missing data.
https://vsp.pnnl.gov/help/vsample/design_trend_mann_kendall.htm
Charles
Thanks for your responses!
Seems many folks have the same issue with #NAME in your sample program. All one needs to do is “enable editing” and it goes away.
Heather,
Thanks for pointing this out.
Charles
Hi Charles,
Is it possible to test smoothed data (i.e. moving average) in Mann Kendall or would be incorrect? The question arise cause I have to test series with several blank points.
Thanks a lot
Eugenio,
You can certainly test such data, but what advantage would it give you?
Charles
Hi Charles . I wonder if you could help me. I have downloaded the excel spreadsheet for Mann-Kendal Test but I am getting” #name” in cells that are supposed to show calculations? What I am doing wrong? I check the formulas , they seem to be correct. hanks
Do you have the Real Statistics software installed? What do you see when you enter the formula =VER() in any cell?
Charles
No. I just downloaded the trial free version . I am looking for statistical software for mann-kendal and sen’s slope test analyses. How can get the software, How much it costs?
There is no trial version. The software is free. You can download and install it from
https://www.real-statistics.com/free-download/real-statistics-resource-pack/
Once you install it, you can find the Mann-Kendall and Sen’s Slope tests by pressing Ctrl-m and selecting this option form the Time Series tab.
Charles
Dear Charles,
I have 30 year period rainfall data and Can I use monthly data for MK test or do I use daily data for the MK test?
Dear Madushani,
You can use annual, monthly, or daily data. The interpretation will be slightly different in each case, but you can use the MK test for any of these.
Charles
Dear Charles,
Thank you very much.
Madushani
Dear Charles
I want to learn Mann Kendall test for my data. Could you suggest me some video links where step by step demonstrations with explanation is there?
Thank you
Pranamika
Dear Pranamika,
I don’t know of a video using Real Statistics. You can find videos on this subject by googling “mann-kendall video”.
Charles
Thank you Charles.
Regards
Pranamika
Hi all,
Please, How to get the P-value with the MK test
See Figure 2 of this webpage.
Charles
Hi Charles,
Can you explain how do we “read” the formula =IF(ROW(D4)-ROW(D$4)>COLUMN(D4)-COLUMN($D4),SIGN($C4-D$3),””)?
thanks
Hi Natalia,
The formula =IF(ROW(D4)-ROW(D$4)>COLUMN(D4)-COLUMN($D4),SIGN($C4-D$3),””) is equivalent to =IF(0>0,SIGN($C4-D$3),””), which takes the value “” since 0>0 is clearly false.
The important thing about this formula is that when it is copied into the other cells in the range under consideration it does what is needed.
Charles
Hello Charles,
Thank you so much for making these tools available. My question:
I have the following data:
9.61
9.64
9.7
9.98
9.88
9.58
9.98
10.15
The p-value produced by the data analysis tool is 0.080905; no trend. My understanding from above is that the p-value for the one-sided test is 1/2 that number, which is less than alpha 0.05 and would indicate a trend, would it not?
Thank you,
Cheryl
Hi Cheryl,
Yes, but you need to decide in advance whether you have ruled out one of the directions for the trend (either upward or downward). You can’t do this after the fact; otherwise, you would always use a one-sided test if you preferred a significant result.
Charles
Hello,
Is there any possibility to get a copy of this Excel book? We are trying to use this for a project. If so, please email me at hunortman@montose-env.com
Hunter
Hunter,
If you are referring to the Excel workbook for this example, please download the Time Series Analysis workbook from
https://www.real-statistics.com/free-download/real-statistics-examples-workbook/
Charles
Thank a lot Charles
But I think in cell D17 you have to put this formula=COUNTIF(E3:$O3,D3) , instead of =COUNTIF(E3:$N3,D3)
Yes, you are correct. I have now made the change on the webpage.
Actually, I used the correct formula on the worksheet but made a mistake when copying it to the webpage.
In any case, thank you very much for identifying this mistake and improving the accuracy of the information provided.
Charles
Is this formula ok: =IF(D18=0,0,D18*(D18+1)*(2*D18+7))? – why is there +7
Shouldn’t it be: =IF(D18=0,0,D18*(D18+1)*(2*D18+5)) – in article it is +5
thanks
Peter
The formula is f(f-1)(2f+5) where f is the ties frequency. The spreadsheet uses d = f-1 and so this makes the formula
f(f-1)(2f+5) = (d+1)d[(2(d+1)+5] = d(d+1)(2d+7).
Charles
Hi Charles,
Is it possible to adapt the calculation for multiplicity if I want to use the MK test on a moving average ?
(cf this paper https://papers.ssrn.com/sol3/papers.cfm?abstract_id=2878419)
Best,
Hello Julien,
I am sorry, but I don’t have time to read this paper. By multiplicity do you mean ties?
Charles
Hi Charles,
I am trying to look at a trend using a moving average. And I understood that by using the same values multiple times in my time series (moving average) I create an artificially high level of significance. The paper suggest to adjust the degree of freedom to increase the p value in a linear regression to reduce the problem and I was wondering how to do that with the MK test.
How to get the value for the D18 cell? Cell E17 = D17 and E18 = IF(COUNTIF($D3:D3,E3)=0,E17,0). What about D18?
Sorry, there is a typo. Cell D18 contains the formula =D17 (not E17).
I have now corrected this on the webpage.
Thank you for finding this error. I appreciate your help in improving the accuracy of the Real Statistics website.
Charles