Granger Causality
As we have learned on many occasions, correlation doesn’t necessarily imply causality, and while we can measure the degree of association between two variables, i.e. correlation, it is harder to determine whether one variable causes another variable.
Although generally, we don’t believe that a present or future event can cause a past event, we do believe that it is possible that a past event can cause a present or future event. This is the impetus for the Granger’s Causality test on time-series data that gives evidence that variable x causes y. Whether this test really demonstrates causality is open to debate, and so we will use the phrase “x Granger-causes y” instead of “x causes y”.
As we will see, x Granger-causes y when the prediction of y is improved by the inclusion of past values of x.
Granger Causality Test
The test is based on the following OLS regression model:
Here, the αj and βj are the regression coefficients and εi is the error term. The test is based on the null hypothesis:
H0: β1 = β2 = … = βm = 0
We say that x Granger-causes y when the null hypothesis is rejected.
We use the usual F test described in Adding Extra Variables to a Regression Model to determine whether there is a significant difference between the regression model shown above (the full model) or the reduced model, based on the null hypothesis, without the βj terms (i.e. where all the βj = 0).
There we demonstrate two equivalent forms of the test:
Here, all the terms are based on the full model with the exception of SS′E and Rr2, which are based on the reduced model.
If the p-value for this test is less than the designed value of α, then we reject the null hypothesis and conclude that x causes y (at least in the Granger causality sense).
Assumptions
The Granger Causality test assumes that both the x and y time series are stationary. If this is not the case, then differencing, de-trending, or other techniques must first be employed before using the Granger Causality test.
Note that the number of lags, i.e. the value of m, is critical, in that different values of m may lead to different test results. One approach to selecting an appropriate value for m is to choose the value that results in the full model with the smallest AIC or BSC value.
It is possible that causation is only in one direction, or in both directions (x Granger-causes y and y Granger causes x) or in neither direction.
Examples
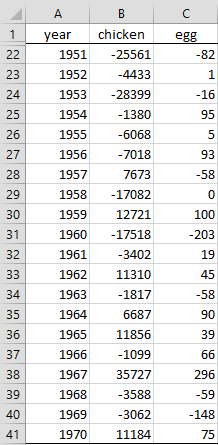
Example 1: Figure 1 shows the egg production and chicken population (including only those birds related to egg production) for the years 1931 to 1970. Determine whether the amount of egg production Granger-causes the size of the chicken population or the chicken population Granger-causes the amount of egg production, or both or neither. This example is a tongue-in-cheek exploration of the common question, “Which came first: the chicken or the egg”?
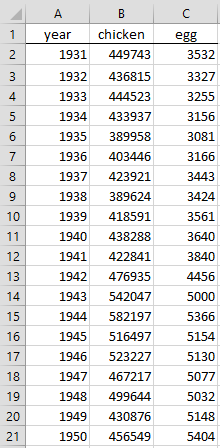
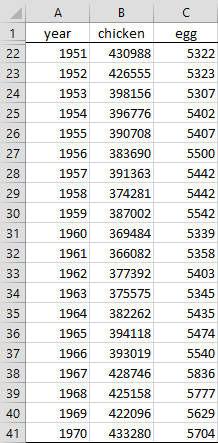
Figure 1 – Chicken and Egg production
A plot of both time series (see Figure 2) shows that neither series is stationary.
Figure 2 – Time series plots
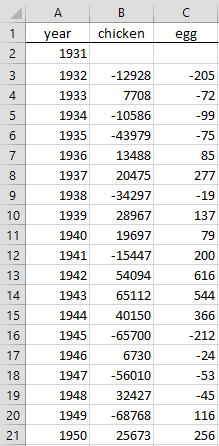
As a result, we will instead study the first differences of each time series. The data and time series plots for these are shown in Figures 3 and 4.
Figure 3 – Differenced time series
Figure 4 – Plots for differenced time series
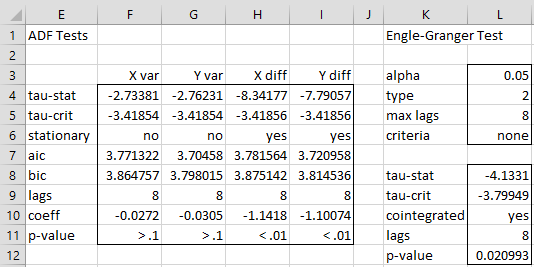
The plots suggest that the time series may be stationary. This result is confirmed by using the ADFtest (see Augmented Dickey-Fuller Test) as shown in Figure 5.
Figure 5 – ADF tests
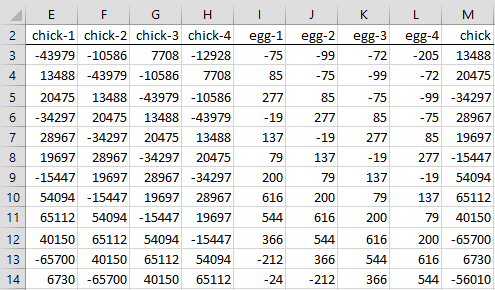
We now show how to determine whether Chickens Granger-cause Eggs for lags = 4. To do this we perform regression on the X data in range E2:L37 of Figure 6 and Y data in range M2:M37 (only the first 12 of 35 rows are shown).
Figure 6 – Setup for regression
We now calculate the p-value of the Granger Causality Test for this data, as shown in Figure 7.
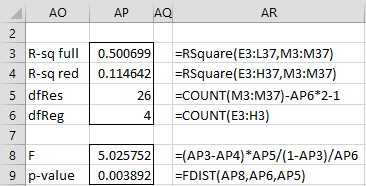
Figure 7 – Test for Granger Causality
Here we use the Real Statistics function RSquare on the full model (cell AP3) as well as the reduced model (AP4), although we could have gotten all the values in the figure by actually conducting the regression.
Since p-value = 0.003892 is small, we conclude that Eggs Granger-cause Chickens for lags = 4. Alternatively, we could have calculated the p-value by placing the Real Statistics formula =RSquareTest(E3:L37,E3:H37,M3:M37) in cell AP9.
Worksheet Functions
Real Statistics Functions: The Real Statistics Resource Pack supports the following two functions that make it easy to determine whether the time series in the column array Rx Granger-causes the time series in the column array Ry at the specified number of lags.
GRANGER(Rx, Ry, lags) = the F statistic of the test
GRANGER_TEST(Rx, Ry, lags) = p-value of the test
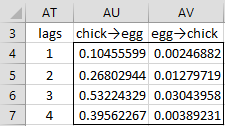
We can use the GRANGER_TEST function to determine whether Eggs Granger-causes Chickens and vice versa at various numbers of lags, as shown in Figure 8.
Figure 8 – Granger Causality Tests
For example, cell AV7 contains the formula
=GRANGER_TEST(C3:C41,B3:B41,AT7)
with references to the data in Figure 3, and produces the same results as in Figure 7.
We see from Figure 8 that Eggs Granger-cause Chickens, but the reverse is not true.
Examples Workbook
Click here to download the Excel workbook with the examples described on this webpage.
Reference
Thurman, W. N. and Fisher, M. E. (1988) Chickens, eggs, and causality, or which came first? American Journal of Agricultural Economics. Vol. 70. No. 2.
http://web.pdx.edu/~crkl/ec571/eggs.pdf


In Figure 7, why is dfRes = n – k*2 – 1, instead of n – k – 1 that was used in other examples?
Hello Kent,
If k = the # of lags, then the formula is dfRes = n – k*2 – 1. If K = the number of independent variables then the formula is dfRes = n – K*2 – 1. This is because k = 2*K. Here K = 4 chicken variables + 4 egg variables.
Charles
Hello,
I’m wondering how small the p-value has to be to indicate a causality.
Hello Luisa,
Generally, p < alpha = .05 is the usual cutoff. Charles
Hi Charles
Just a quick question, what if my data is listed in descending order, will that affect the result? For example, in the example, year goes from 1930-1970, and start from 1930, what if my data start from 1970 in row 1?
Hi Pie,
I don’t know. I suggest that you try it.
Charles
hey charles
sorry for the super later reply, the results are different. LOL
Hello Pie,
Thanks for sharing that. Not sure what to make of it though.
Charles
I just simply turned my data upside down, but still working on the reason
Dear Charles,
I am wondering how to deal with a result that shows me a causation in both directions. Then, taking the example of the chicken and egg, the egg would granger cause the chicken but the chicken also granger causes the egg, how does that make sense and how is it possible to get such results?
Thank you and have a great weekend.
Best regards
Alex
Alex,
This is one of the reasons that Granger-causation is not the same thing as causation.
Charles
So then it simply means, in my sample there are periods where the egg predicts the chicken and during others the chicken predicts the egg?
Hello Charles
First of all thank you for all this great formulas! I have a question concerning the Granger formula: As an output it gives the F Statistics of the granger test, do you have any advice to get the T statistics?
Best regards
Alex
Hello Alex,
The key formula is T(df)^2 = F(1,df)
Charles
1) I could not reproduce your results shown in Figure 5. My Excel 365 shows lags = 1. Could you show the ADFTest command?
2) You mention E2:L37 in the text but the command goes E3:L37? I think it would be great if you were able to show all the rows in Figure 6 just like you did in Figures 1 and 3.
3) Column M in Figure 6 goes to row 36. Did you mean L36, M36?
4) What is the purpose of columns E,F,G, and I,J,K in Figure 6 if the example was only interested in lag=4?
TIA
Also the Granger_test functions have a maximum lag of 32?
In general, the number of lags is not limited to 32. The limit depends on the size of the sample.
Charles
I have just added a link to the Excel spreadsheets containing the examples shown on this webpage.
I hope this clarifies the issues that you have raised.
Charles
Hello sir,
what if the p-value of the test is zero? In my excel sheet it shows on lag 2 with the Granger_test = 0.
Thanks!
Hello Selman,
p-value = 0 can be viewed like p-value = .00001 or some small value. It indicates a significant result.
Charles