Basic Concepts
When a time series x1 , …, xn contains only binary values, 0’s and 1’s, then we can use a change point test based on the two-sample Kolmogorov-Smirnov test.
Such a time series can occur, for example, when xi = 1 if the stock market went up on day i and xi = 0 if the stock market went down. It can be used when each xi = 1 if the ith trial was successful (in a game or treatment) and xi = 0 if the ith trial was a failure.
Test Description
We now describe the test. First, define Si for each i and let m = Sn
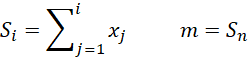
We also define the test statistic D
![]()
We can now use the two-sample KS test on the test statistic D to determine whether there has been a change in the distribution of points in the time series. If so, this point occurs at time = i where the maximum occurs in the calculation of D.
Example
Example 1: Conduct the change-point test for the time series in range B2:B50 of Figure 1.
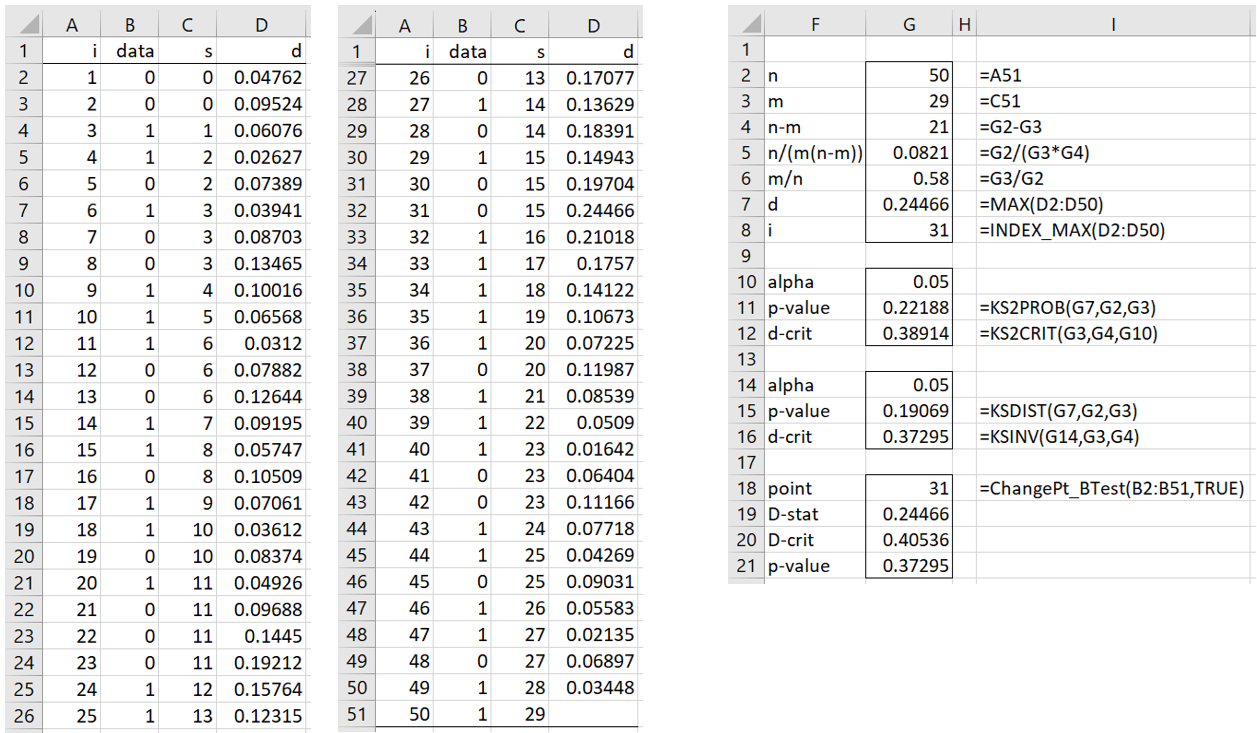
Figure 2 – Change-Point Test (binary data)
We fill in column C by inserting the formula =B2 in cell C2 and =B3+C3 in cell C3, highlighting range C3:C51, and then pressing Ctrl-D. We fill in column D by inserting the formula =ABS(G$5*(C2-G$6*A2)) in cell D2, highlighting range D2:D50, and pressing Ctrl-D.
The remaining calculations using Excel are shown on the right side of Figure 2. After finding the D value of .24466 (cell G7), we calculate the Dcrit value for the samples of size 29 (cell G3) and 21 (cell G4) via the formula
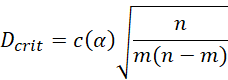
as described in Two-sample Kolmogorov-Smirnov Test. For α = .05, we see from the KS table of critical values that c(.05) = 1.3581. Thus, for Example 1,
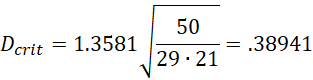
We get the same result by using the Real Statistics formula =KS2CRIT(G3,G4,G10) as shown in cell G12. Since D = .24466 < .38941 = Dcrit, we can’t reject the null hypothesis and conclude that there is no change point. Actually, we can estimate a p-value = .22118 (cell G11), which once again shows that we don’t have a significant result when α = .05.
Instead of using the table lookup values described above, we can use the Kolmogorov distribution to calculate the critical value and p-value, as shown in cells G16 and G15. These values are only slightly different.
Worksheet Function
Real Statistics Function: The Real Statistics Resource Pack provides the following function for the time series data in the column array or cell range R1 containing only zeros and ones.
CHANGEPT_BTEST(R1, lab, dist, alpha): returns a column array with the values change point, D-stat, D-crit, and p-value
If lab = TRUE (default FALSE) a column of labels is appended to the output.
If dist = TRUE (default) then KSDIST and KSINV are used to calculate Dcrit and p-value; otherwise, the table lookup functions KS2PROB and KS2CRIT are used. alpha is the significance level (default .05)
We can use this function to get the results for Example 1, as shown in range F18:G21 of Figure 1.
Examples Workbook
Click here to download the Excel workbook with the examples described on this webpage.
References
Siegel, S., Castellan, N. J. (1988) Nonparametric statistics for the behavioral sciences, 2nd ed.
https://psycnet.apa.org/record/1988-97307-000