Basic Concepts
For a time series x1, …, xn, it is possible that at some point prior to time n, there is some change that shifts the median. This change may be a policy change, administration of some treatment, traumatic event, etc. In the one-tailed test you predict the direction of change, while in the two-tailed test, any change (up or down) is sufficient.
This test is also called Pettitt’s test.
Test Description
If the time series takes numeric values from a continuous variable, then define ri to be the rank of xi and define
Now define m to be the value of i < n where ui is at its maximum. This is the potential change point. If more than one such i exists, select the first one. Define w to be wm.
We now need to test whether the value of ui is larger than we would expect by chance.
For n sufficiently large (when m > 10 or n–m > 10), under the null hypothesis that there is no change in direction, we can assume that w is normally distributed with the following mean and variance
![]()
Employing a continuity correction factor of .5, we can use the test statistic z ∼ N(0,1) where
and
![]()
In the case of ties, the variance needs to be adjusted as for the one-sample signed-ranks test.
Example
Example 1: For the time series shown in column B of Figure 1, determine whether there is a point-change, and if so when did it occur.
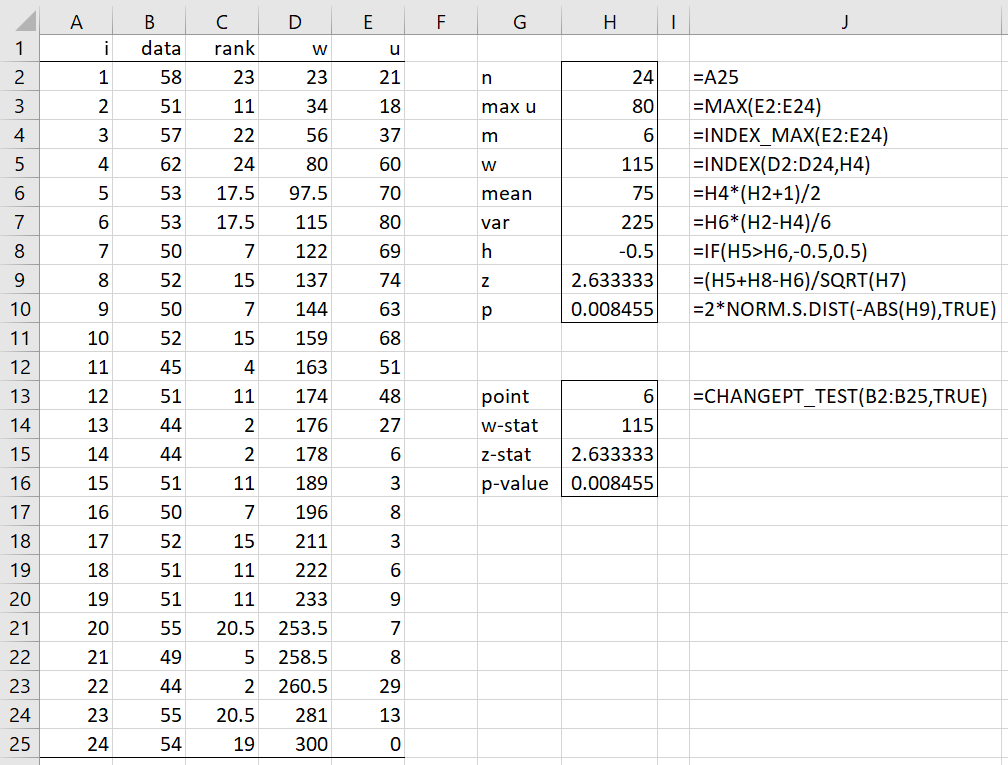
Figure 1 – Change-Point Test
The various Excel calculations are shown in Figure 1. E.g. cell C3 contains =RANK.AVG(B3,B$2:B$25,1), cell D3 contains =D2+C3, and cell E3 contains =ABS(2*D3-A3*(A$25+1)).
We only use one Real Statistic function, namely INDEX_MAX (in cell H4), although we can obtain this value by just observing where 80 occurs in column E. Alternatively, we can use the Excel formula =MATCH(E2:E24,MAX(E2:E24),0).
From cell H4, we see that a potential point change occurs at time = 6. Since n – m = 24-6 = 18 > 10, we use the normal approximation to determine whether this point change is significant.
We see that p-value = .008455 (cell H10), which is a highly significant result. We conclude that there is a point change and that it occurs at time = 6.
Worksheet Function
Real Statistics Function: The Real Statistics Resource Pack provides the following function for the time series data in R1.
CHANGEPT_TEST(R1, lab): returns a column array with the values change point, w-stat, z-stat, and p-value
R1 must be a column array or range with no missing data. If lab = TRUE (default FALSE) a column of labels is appended to the output.
We can use this function to get the results for Example 1, as shown in range G13:H16 of Figure 1.
Data Analysis Tool
The Change Point Test (with continuous data) can also be performed using the Trend and Change Point Tests data analysis tool, as demonstrated in Sen’s Slope.
Test with Binary Data
Click here for information about the change-point test with binary data.
Alternative Version
Pettitt (1978) describes the following alternative version of the change-point test. For each j = 1, …, n define
![]()
![]()
![]()
![]()
Example
Figure 2 displays the results of this alternative approach for Example 1.
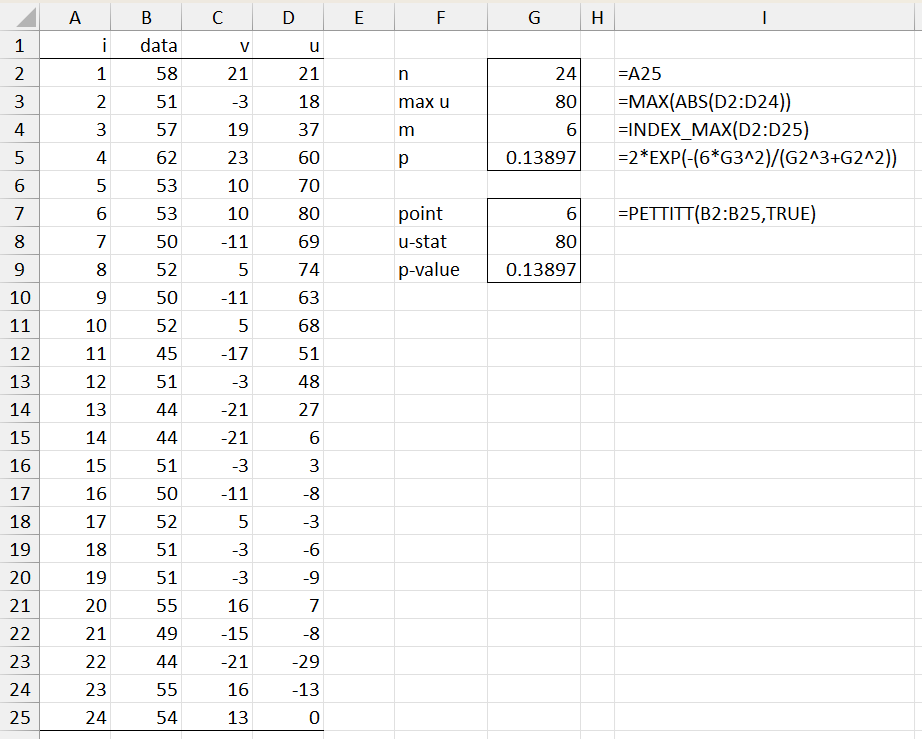
Figure 2 – Alternative Change-Point Test
Here, for example, cell C3 contains the formula =SUMPRODUCT(SIGN(B3-B$2:B$25)) and cell D3 contains the formula =C3+D2.
Worksheet Function
Real Statistics provides the following worksheet function to support this version of the test.
PETTITT(R1, lab): returns a column array with the values: change point, u-stat and approximate p-value
Examples Workbook
Click here to download the Excel workbook with the examples described on this webpage.
References
Siegel, S., Castellan, N. J. (1988) Nonparametric statistics for the behavioral sciences, 2nd ed.
https://psycnet.apa.org/record/1988-97307-000
Bruns, D. (2024) Position of max value in list
https://exceljet.net/formulas/position-of-max-value-in-list
Pettitt, A. N. (1978) A non-parametric approach to the change-point problem
https://www.jstor.org/stable/2346729
Pohlert, T. (2023) Non-parametric trend tests and change-point detection
https://cran.r-project.org/web/packages/trend/vignettes/trend.pdf
Hello, Mr. Charles
A couple questions please
1. cell C3 contains =RANK.AVG(B3,B$2:B$25,1), cell D3 contains =D2+C3, and cell E3 contains =ABS(2*D3-A3*(A$25+1)). — How did you populate D2 and C2?
2. How do I find out if there are multiple changes in the data?
Hello Tade,
1. C2 contains =RANK.AVG(B2,B$2:B$25,1) and D2 contains =C2
2. I don’t know how to test for multiple changes in the data. One approach might be to split the time series into two segments and see whether there is a change point in both segments. You probably need to be clever about how to do this splitting.
Charles
Hi Charles,
it seems that CHANGEPT_TEST(R1, lab) doesn’t work with the last Resource Pack
Excel error #NAME?
Other functions, like INDEX_MAX(), are ok
forget it, my bad, it works.
sorry Mr Charles, i have some other questions:
1) you wrote in cells h =IF(H10>H11,-0.5,-5) but i ve reade above that maybe if w<mean +0.5 is applied. maybe i misunderstood?
2) why do you use =INDEX_MAX(E7:E29) instead of Excel native MATCH(E7:E29,'max u';0)?
3) what the formula for p would be if m<10 or n-m<10?
thank you
Hello Eugenio,
1) Yes, this formula should be =IF(H10>H11,-0.5,.5). Thank you for catching this error.
2) You can use =MATCH(H3,E2:E24,0)
3) I don’t have a formula in this case. Usually, you would use a table of values, but I don’t know of such a table.
Charles