Basic Concepts
An ARMAX model (i.e. an ARIMA model with an exogenous variable) without constant takes the form

This is simply an ARMA model with an extra independent variable (covariant) on the right side of the equation. Using the lag operator, this is equivalent to
One way to deal with such a model is to reinterpret it as a linear regression plus ARMA errors:
![]() where
where
This model is equivalent to
![]()
Example
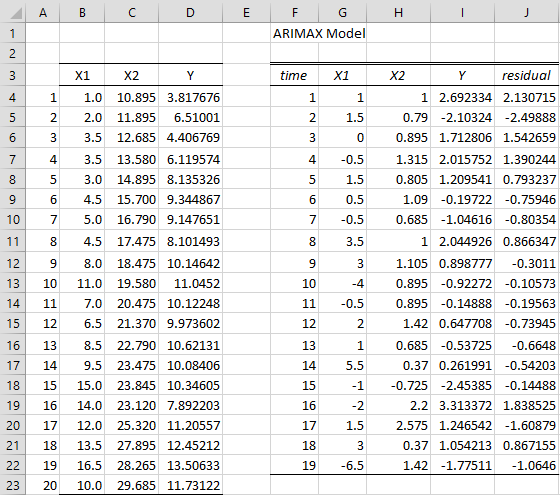
Example 1: Create an ARIMAX model for the data on the left side of Figure 1 where X1 and X2 are exogenous variables and Y is a time series. Create a forecast for the next 3 elements based on this model.
Figure 1 – Initialization of the ARIMAX model
Real Statistics Data Analysis Tool: You can use the ARIMAX data analysis tool to do this. Press Ctrl-m, select ARIMAX from the Time S tab and fill in the dialog box that appears as shown in Figure 2.
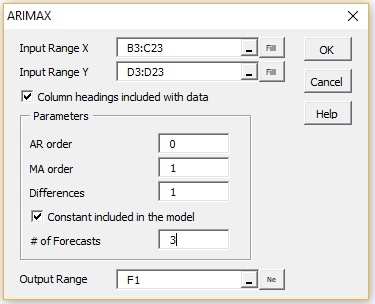
Figure 2 – ARIMAX dialog box
Output
We show the results on the right side of Figure 1 as well as in Figure 3 and 4.
In Figure 1, range G4:G22 contains the array formula =ADIFF(B4:B23,1), range H5:H22 contains =ADIFF(C4:C23,1) and I5:I22 contains =ADIFF(D:D23,1).
The left side of Figure 3 contains the usual regression analysis of X1 and X2 on Y, which results in the regression model
The residuals are calculated by
where we are expecting the residuals to follow an ARIMA(0,0,1) model. These residuals are shown in range J5:J22 of Figure 1, as calculated by the array formula
=I4:I22-TREND(I4:I22,G4:H22,,TRUE)
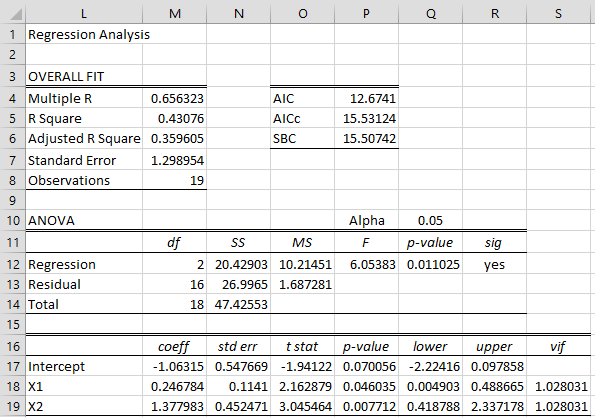
Figure 3 – OLS Regression model
ARIMA model for residuals
The residuals from the OLS regression model now become the data elements for the ARIMA model, as shown in Figure 4. Note that the constant term is subsumed in the regression model and so is not included in the ARIMA model. Similarly, the differencing has already been accounted for and so is not part of the ARIMA model. Thus, we are assuming that the residuals follow an MA(1) model.
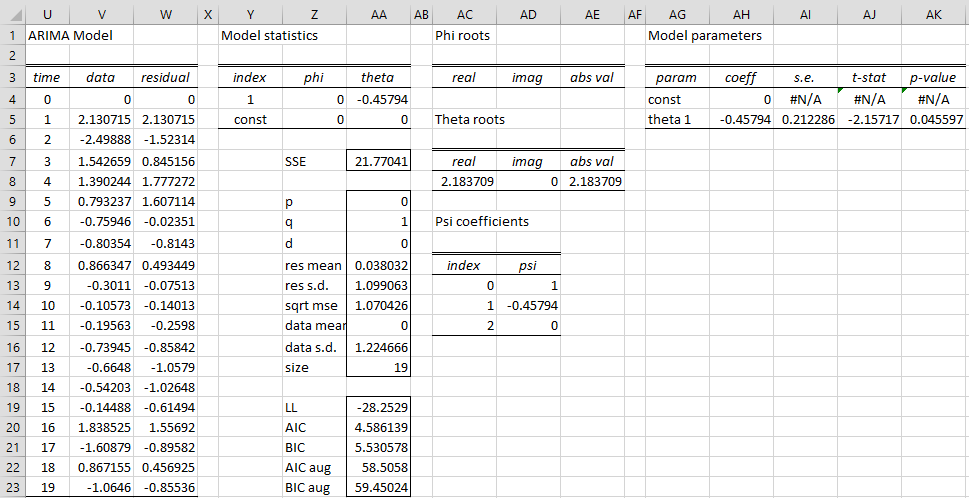
Figure 4 – ARIMA(0,0,1) model for the residuals
Forecast
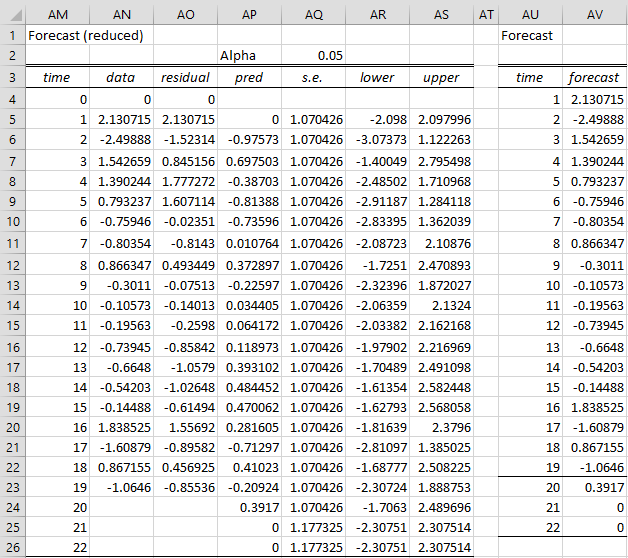
The forecast for the model shown in Figure 4 is shown in Figure 5. Note that the zero forecast values shown in cells AV24 and AV25 wouldn’t necessarily be zero if we had used a different ARIMA model for the residuals.
Figure 5 – Residuals forecast
The forecast in Figure 5 is only for the residuals times series. We now need to create a forecast for the original time series at times t = 21, 22 and 23, based on the values we expect for the exogenous variables X1 and X2 at those times.
Suppose that these exogenous variables take the values shown in range B24:C26 of Figure 6. Note that this figure shows the bottom part of corresponding columns from Figure 1, where the added rows correspond to the three forecast values.
The added entries in range D24:D26 show the forecasted values for the original time series at times t = 21, 22 and 24 corresponding to the X1 and X2 values shown in B24:C26. These forecasted values are calculated as shown in Figure 6.
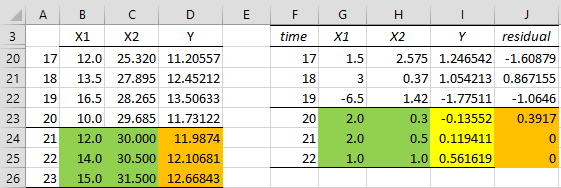
Figure 6 – Time series forecast
Place the formula =B24-B23 in cell G23, highlight range G23:H25 and press Ctrl-R and Ctrl-D. This differences the new X1 and X2 values. Next, place the array formula =TREND(I4:I22,G4:H22,G23:H25) in range I23:I25. This calculates the differenced Y forecast values.
Now place the formula =AV23 in cell J23, highlight the range J23:J25 and press Ctrl-D, to show the forecasted residual values. Finally, insert the formula =D23+I23+J23 in cell D24, highlight the range D24:D26 and press Ctrl-D to obtain the requested forecast for Y.
Examples Workbook
Click here to download the Excel workbook with the examples described on this webpage.
References
Andrews, B. H., Dean, M. D., Swain, R., Cole, C. (2013) Building ARIMA and ARIMAX models for predicting long-term disability benefit application rates in the public/private sectors
https://www.soa.org/49384d/globalassets/assets/files/research/projects/research-2013-arima-arimax-ben-appl-rates.pdf
Geeks for Geeks (2024) What is an ARIMAX model?
https://www.geeksforgeeks.org/what-is-an-arimax-model/
Hello, Charles. Thank you for the tools. When i was forecasting with ARIMAX model, there was a message that said “a run time error was ocured. The analysis tool will be aborted. Application defined-or object defined error”. Could you help me?
and why does the forecast use Arimax residual values, why not use the original data?
Hello,
Can you email me your data so that I can figure out why a run time error occurred?
I will answer your second question shortly.
Charles
You can use the original data. I have elected to use the residuals instead.
Charles
Hi Charles..
i am Riana, from Indonesia. in the material you wrote it says that “use ARIMAX data analysis tool to do this,Press Ctrl-m”, but I’m having trouble with ms excel, I can’t use the shortcut ctrl-m. what should i do, charles?
thanks, Charles
I hope you reply to this comment,
Hi Riana,
See https://www.real-statistics.com/real-statistics-environment/accessing-supplemental-data-analysis-tools/
Charles
thanks for the reply, charles. i am sory, i want to ask again. i am currently conducting research on forecasting household electrical energy needs using the time series method with a calender variation. and the data patterns formed are seasonal and trend patterns. can you give me some advice, what time series method should i use ? and how to use that method with calender variatons?
thanks charles
Hello Riana,
Depending on the nature of your data, you might be able to use the SARIMA data analysis method or Holt-Winters. See
SARIMA
Holt-Winters Multiplicative
Holt-Winters Additive
Charles
Good evening Carlos!
I’m doing a college project on demand forecasting and we should use a method that we didn’t learn in class. My group chose the ARIMAX model, but as we haven’t seen anything in class about this model, we’re having some difficulties. Could you send me this spreadsheet that you used in the example?
My email is kevintiscoski@gmail.com
I would be very grateful. Hugs from Brazil!
Hi Kevin,
Good to communicate with someone from Brazil. I have very fond memories of my trips to your country.
You can download any of the spreadsheets shown on the Real Statistics website by going to
https://www.real-statistics.com/free-download/real-statistics-examples-workbook/
Charles
Perfect. Thank you Charles!
Charles, thanks for your tool. I am learning a lot about time series analyses and getting a lot out of your tool.
I’ve tried to replicate your above example to ensure I understand the last steps to predict the next values. However, I get a different result than you do in cells I24 and I25. Should the formula in those two cells also be exactly “=TREND(I4:I22,G4:H22,G23:H25)”?
Thanks.
Hello Curtis,
Yes, that is true since the values in J24 and J25 are zero.
Charles
I’m getting -0.135513849 in cells I23, I24, and I25.
Hello Curtis,
Can you email me the spreadsheet where you get this result?
Charles
Hello Charles,
I have the same problem as Curtis, may I ask which step went wrong?
I see the problem now. On my computer, running Excel 365, the formula in range I23:I25 is written as =@TREND(I4:I22,G4:H22,G23:H25). This yields -1.3552 in each cell.
The formula should be =TREND(I4:I22,G4:H22,G23:H25), without the @. This yields the values shown on the webpage. I still need to explore why the @ has been added incorrectly.
Thank you for bringing this issue to my attention.
Charles
After following up on another comment that identified the sample problem, I see what is going wrong.
On my computer, running Excel 365, the formula in range I23:I25 is written as =@TREND(I4:I22,G4:H22,G23:H25). This yields -1.3552 in each cell.
The formula should be =TREND(I4:I22,G4:H22,G23:H25), without the @. This yields the values shown on the webpage. I still need to explore why the @ has been added incorrectly.
Thank you for bringing this issue to my attention.
Charles