Seasonality
If a time series has a seasonal component, then we can combine one of the imputation approaches described in Figure 1 of Handling Missing Time Series Data with either deseasonalizing or split seasonal imputation (as shown in Figure 1) based on the seasonality period (i.e. 4 for quarterly, 12 for monthly, etc.).
| Numeric label | Text label | Seasonality type |
| 0 | none | no seasonality |
| 1 | seas | deseasonalizing |
| 2 | split | split seasonality |
Figure 1 – Seasonality Imputation
We now show how to perform imputation for the missing time series elements in column G of Figure 2.
Split seasonality
This approach is straightforward. If there are say 4 seasons then the time series is treated as 4 separate time series, one for each season. Imputation for each of these separated time series is then performed based on the selected imputation approach from Figure 1 of Handling Missing Time Series Data.
Example 1: Apply the split seasonality approach to impute the missing elements for the time series in column G of Figure 2.
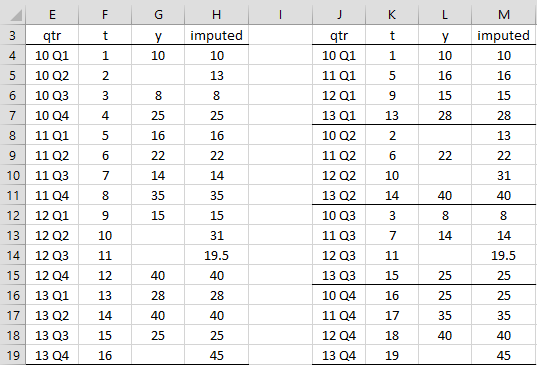
Figure 2 – Split seasonality imputation
If we assume that we want to perform weighted moving average imputation with span 2, then effectively the time series in column G of Figure 2 is split into the four time series shown on the right side of Figure 2. E.g. the time series corresponding to Q2 is shown in range L8:L11. The imputed values for this series, shown in range M8:M11, can be calculated by the array formula =TSImputed(L8:L11,”wma”,2). Putting the four imputed time series back together in the original order yields the imputed time series shown in column H.
Deseasonalizing
In this approach, the data is deseasonalized using the seasonality period. E.g. if the seasonality period is per = 4, then the time series y1, y2, …, yn is replaced by z1, …, zn-4 where zi = yi + 4 – yi. If either yi+4 or yi is missing then zi is considered missing. Any such missing zi is now imputed as described previously using the imputation approach specified by itype (as described in Handling Missing Time Series Data). The original time series yi is now restored by reseasonalizing using the imputed zi values.
This approach requires that the first per elements of the original time series are not missing (in order to reseasonalize). If one of these values is missing, we use the split seasonality approach to impute any of the missing elements among the first per elements in yi.
We illustrate this approach for the same time series shown in Figure 2. This is repeated in column G of Figure 3.
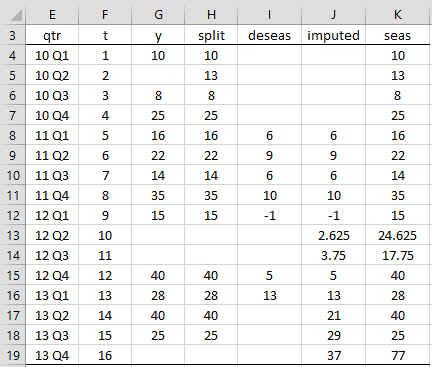
Figure 3 – Deseasonalizing Approach
Explanations
Since one of the first four elements in the time series is missing (cell G5), we impute this value using the split seasonality method, as shown in column H. We place the array formula =TSImputed(G4:G19,”wma”,2,”split”,4) in range H4:H7 (see below for a description of the TSImputed function) and the array formula =IF(G8:G19=””,””,G8:G19) in range H8:H19.
We next insert the formula =IF(H4=””,””,IF(H8=””,””,H8-H4)) in cell I8, highlight the range I8:I19 and press Ctrl-D to obtain the deseasonalized time series. Now we impute the missing values in this time series by placing the array formula =TSImputed(I8:I19,”wma”,2) in range J8:J19.
Now, we place the array formula =H4:H7 in range K4:K7 and then reseasonalize by placing the formula =IF(G8=””,J8+K4,G8) in cell K8, highlighting the range K8:K19 and pressing Ctrl-D. The result is the imputed time series shown in column K.
Worksheet Function
Real Statistics Function: The Real Statistics function TSImputed, described in Handling Missing Time Series Data, can be expanded to support seasonal imputation. The function now takes the form:
TSImputed(R1, itype, k, stype, per): returns a column array of the same size as R1 where each missing element in R1 is imputed based on the imputation type itype and k, as described in Handling Missing Time Series Data. These are augmented by stype which is either a number or text string as shown in Figure 1 (default 0 or “none”) and per, the seasonal period (default 4 for quarterly), which is only used when stype is not “none”.
For example, =TSImputed(G4:G19,”wma”,2,”split”,4) returns the time series shown in range H4:H19 of Figure 2. =TSImputed(G4:G19,”wma”,2,”seas”,4) returns the time series shown in range K4:K19 of Figure 3.
Examples Workbook
Click here to download the Excel workbook with the examples described on this webpage.
References
Geeks for Geeks (2023) How to deal with missing values in a timeseries in Python?
https://www.geeksforgeeks.org/how-to-deal-with-missing-values-in-a-timeseries-in-python/
Kusawa, S. (2023) Handle missing values in time series datasets: 10 best techniques
https://datamagiclab.com/handle-missing-values-in-time-series-datasets/