Basic Concepts
On this webpage we show how to use a Hampel filter to detect and remove outliers from time series data. For any xi in the time series, the general approach is to calculate the median mi for a window centered around xi of fixed length. If xi differs from mi by more than a fixed number of standard deviations then xi is considered to be an outlier and is replaced by mi. Here the number of standard deviations is estimated to be the median average deviation (MAD) multiplied by 1.4826.
Test
For a time series x1, …, xn and window size 2k+1, define
Wi = {xj: |i–j| ≤ k} = {xi-k, …, xi, …, xi+k}
mi = Median(Wi)
Vi = {|xi-k–mi|, …, |xi–mi|, …|xi+k–mi|}
Mi = MAD(Wi) = Median(Vi),
Finally, define the standard deviation
σi = 1.4826 Mi
For a fixed multiplier κ > 0, an element xi is an outlier if |xi – mi| > κσi. An outlier xi is filtered by replacing it by mi.
E.g. if we classify an element in the time series as outlier when it is more than 3 standard deviations from the median of its window, then we would set κ = 3. Note that we are estimating “standard deviation” from the MAD by using the multiplier described in Property 3 of Measures of Variability for normally distributed data.
Truncated Windows
The above definition of outlier works well for elements xk+1, …, xn-k. Elements x1, …, xk have a full complement of k elements to their right but not to their left (assuming n > 2k). Similarly, elements xn-k+1, …, xn have a full complement of k elements to their left but not to their right. We therefore change the definition of Vi slightly for such elements, as follows:
Vi = {|x1–m1|, |x2–m2|, …, |xi-1–mi-1|, |xi–mi|, …, |xi+k–mi|} for i ≤ k
Vi = {|xi-k–mi|, …, |xi–mi|, |xi+1–mi+1|, …, |xn-1–mn-1|, |xn–mn|} for i > n–k
We still define Mi to be Median(Vi) in these cases.
Example
Example 1: Find the outliers for the time series 200, 3, 5, 7, 123, 8, 50, 11 (also shown in range A2:A9 of Figure 1) and determine the Hampel filter for this time series where k = 3 and κ = 3.
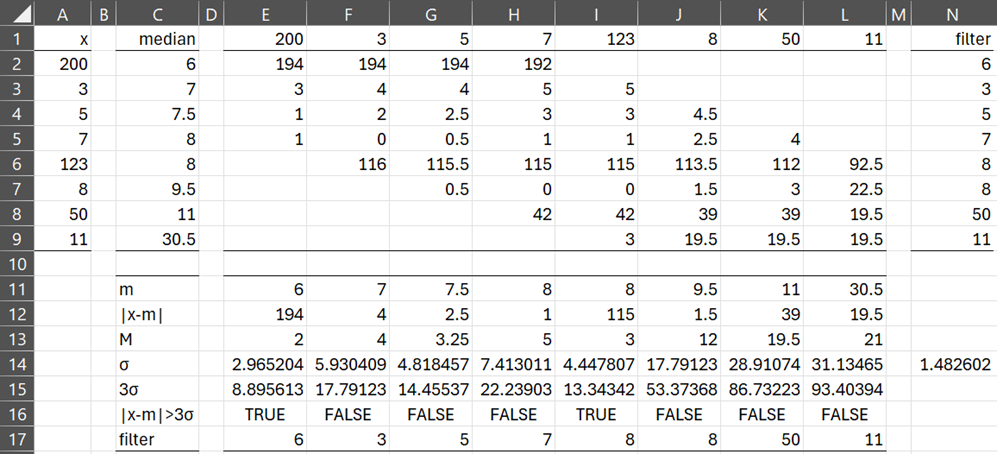
Figure 1 – Hampel filter example
This time series consists of the elements x1, …, x8 shown in range A2:A9. The corresponding medians m1, …, m8 are displayed in range C2;C9. E.g. C2 contains the formula =MEDIAN(A2:A5), C4 contains the formula =MEDIAN(A2:A7), and C6 contains the formula =MEDIAN(A3:A9).
The time series values are repeated in range E1:L1 using the array formula =TRANSPOSE(A2:A9). Similarly, the median values are repeated in range E11:L11 using the array formula =TRANSPOSE(C2:C9).
Each column E through L provides information about the time series element in the first row of that column. In particular, x1 appears in E1 and E2:E9 contains the elements in V1. E.g. E2 contains the formula =ABS(A2-C$2), and similarly for the other cells in column E.
Similarly, ranges F2:F9 through L2:L9 contain the elements in V2 through V8.
More formulas
We test whether x1 is an outlier, as shown in range E12:E16 using the formulas shown in Figure 2.
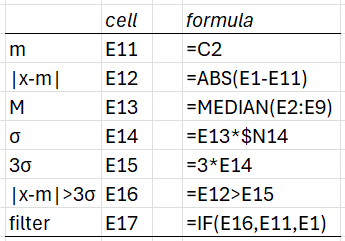
Figure 2 – Hampel filter example formulas
Note too that cell N14 contains the formula =1/NORM.S.INV(0.75).
We see from cell E16 that |x1 – m1| > 3σ, and so we conclude that x1 = 200 is an outlier and so it should be replaced by m1 in the filter, as shown in cell E17.
After entering the formulas shown in range E12:E17 of Figure 2, we can next highlight range E12:L17 and press Ctrl-R. This will fill in all the values shown in range E12: L17 of Figure 1. We see from that figure that x1 = 200 and x5 = 123 are outliers. The filtered version of the time series is shown in row 17 of Figure 1, and duplicated in range N2:N9.
Worksheet Function
The Real Statistics Resource Pack provides the following worksheet function.
HAMPEL(R1, nlen, xsigma): returns a column array of the same size as the column array or cell range R1. Each element is either equal to the associated element in R1 or is the appropriate median if the associate element is an outlier.
nlen = # of adjacent data elements on either side of the data element (default 3). xsigma = # of standard deviations (i.e. # of MAD’s times 1.4826).
For Example 1, =HAMPEL(A2:A9) returns the array N2:N9.
Examples Workbook
Click here to download the Excel workbook with the examples described on this webpage.
References
MathWorks (2024) Hampel
https://it.mathworks.com/help/signal/ref/hampel.html
Wicklin, R. (2021) The Hampel identifier: robust outlier detection in a time series
https://blogs.sas.com/content/iml/2021/06/01/hampel-filter-robust-outliers.html