Basic Concepts
A time series with a (linear) deterministic trend can be modeled as
Now E[yi] = μ + δi and var(yi) = σ2, and so while the variance is a constant, the mean varies with time i; consequently, this type of time series is also not stationary.
These types of time series can be transformed into a stationary time series by detrending, i.e. by setting zi = yi – δi. In this case zi = μ + εi, which is a purely random time series.
In a similar fashion, we can speak about a quadratic deterministic trend (yi = μ + δi + εi) or various other varieties of deterministic trends.
The types of random walks described previously are said to have a stochastic trend. We can also have random walks with a deterministic trend. These take the form
where δ is a constant. These are not stationary and require differencing and detrending to be transformed into a stationary time series.
Example
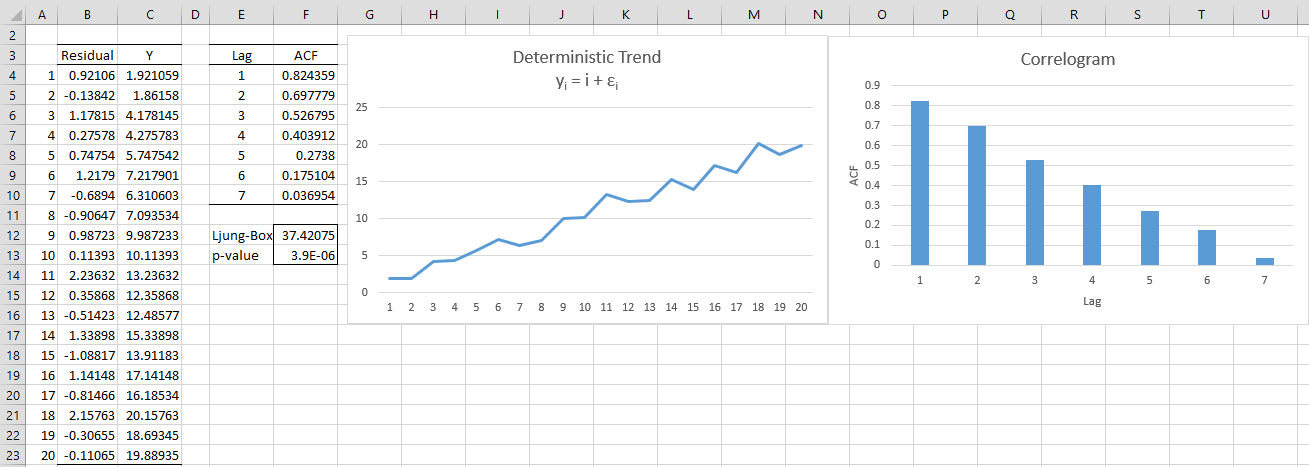
Example 1: Graph the time series with deterministic trend yi = i + εi) where the εi ∼ N(0,1).
The graph is shown in Figure 1. All the cells in column B contain the formula =NORM.S.INV(RAND()) and cell C4 contains the formula =A4+B4 (and similarly for the other cells in column C).
As we can see, once again the graph shows a clear upward trend and the ACF shows a slow descent.
Figure 1 – Deterministic Trend
This time we get rid of the trend by detrending as shown in Figure 2. E.g. cell C4 contains the formula = B4-A4 (where column B replicates the values in column C from Figure 1). We see from the chart that the trend has been eliminated. We also see from the Ljung-Box test (cell F13) that the ACF values for the first 7 lags are statistically equal to zero, consistent with a purely random process.
Figure 2 – Detrending
Examples Workbook
Click here to download the Excel workbook with the examples described on this webpage.
References
Greene, W. H. (2002) Econometric analysis. 5th Ed. Prentice-Hall
https://www.ctanujit.org/uploads/2/5/3/9/25393293/_econometric_analysis_by_greence.pdf
Hamilton, J. D. (1994) Time series analysis. Princeton University Press
https://press.princeton.edu/books/hardcover/9780691042893/time-series-analysis
Wooldridge, J. M. (2009) Introductory econometrics, a modern approach. 5th Ed. South-Western, Cegage Learning
https://cbpbu.ac.in/userfiles/file/2020/STUDY_MAT/ECO/2.pdf


Good evening, I’ve a question.
In the case in which we are dealing with a model AR(1) with a deterministic trend.
Let’s say : rt = constant + delta * t + alpha* r_{t-1} + error term , with alpha < 1. What can we say about the convergence in probability of the sample mean of rt?
I would say that we cannot say anything since there's no stationarity implied by the linear trend, but what would happen if I detrend the time series for the linear trend?
Can I say that r_t – \delta *t converges in probability to the unconditiona expectation = constant / (1-\alpha)?
Sorry, Gabriele, but I don’t know the answer to your question.
Charles
Hi Charles,
Is detrending of time series regressions by addition of a trend variable equivalent to the detrending procedure described above? I.e. The trend variable takes a value of 1 for the time interval (e.g. year) of the first observation, and rises in proportion to the time intervals of subsequent observations.
Thank you,
Gareth
Hi Gareth,
Do you have a particular reference to “detrending of time series regressions by addition of a trend variable”? I think the answer to your question is “yes”, but I want to make sure that I understand your question correctly.
Charles
Hi Charles,
Wooldridge (2016) Introductory Econometrics.
https://www.pdfdrive.com/introductory-econometrics-a-modern-approach-e158283770.html
From p. 334 he discusses the use of a trend variable t.
Best Regards,
Gareth
Thanks, Gareth.
Charles
Hello, Sir,
I’m doing data forecasting with Sarima. The sarima model that I got is sarima (0,1,1)(0,1,0)12 , how do I find the residual value of the model in excel? What are the steps to test the white noise of the model in excel?
Thankyou,Sir.
Riana,
Residuals are calculated by yi – zi where yi is the observed data value and zi is the forecasted value produced by the model. These values are available from the SARIMA tool. You then perform any one of the white noise tests described on the website to test the residuals.
Charles
Hello sir,
I want to ask, how did you get the Residual data?
I know that it’s from formula =NORM.S.INV(RAND()), but where did it come from?
Thank you, sir.
Ann,
The formula =NORM.S.INV(p) yields a value on the standard normal bell curve whose cumulative probability is p, where p is any value from 0 to 1. =RAND() is a formula that generates a random value from 0 to 1. Thus, the formula =NORM.S.INV(RAND()) generates a value on the standard normal bell curve.
Charles
In this example, how did you decide the number (k) of lags to test? i.e. why did you decide upon the first 7, and not the first 10 etc.?
Thank you for any help, it is much appreciated
Hello Anshu,
If I remember correctly, it was a bit of trial and error. I picked a value that was sufficiently large.
Charles