In SARIMA Model Example we show how to create a SARIMA model for the following example, step by step, in Excel.
Example
Example 1: Create a SARIMA(1,1,1) ⨯ (1,1,1)4 model for Amazon’s quarterly revenues shown in Figure 1 and create a forecast based on this model for the four quarters starting in Q3 2017.
We now show how to use this model to create a forecast.
We can create a forecast based on the coefficients estimated by this model (shown in AK3:Al7 of Figure 1) using the following equation:
![]()
Forecast
Since the last data element is y25, we want to determine the forecasted values of y26,. y27, y28 and y29. To do this, we use the above formula using data values of yi-1,. yI-4 and yi-5 when available, and (previously obtained) forecasted values when the real data values are not available. This is shown in Figure 1.
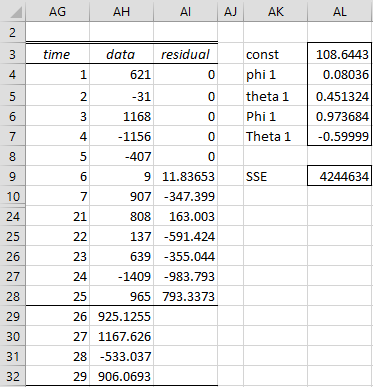
Figure 1 – Forecast for the differenced time series
This figure shows the data values and residuals for the later portion of the time series (leaving out the middle) plus the forecasted values. E.g. the forecast value in cell AH29 is calculated by the formula
=AL$3+AL$4*AH28+AL$6*AH25-AL$4*AL$6*AH24+AL$5*AI28 +AL$7*AI25+AL$5*AL$7*AI24
After entering this formula, you can highlight the range AH29:AK32 and press Ctrl-D to obtain the other three forecast values. Note that the residuals corresponding to the four forecast values are implicitly set to zero.
Undoing Differencing
Now that we have the forecasted values for the time series shown in column Q of Figure 3 of SARIMA Model Example, we need to translate these into forecast values for the original time series (column O in Figure 3 of SARIMA Model Example). To accomplish this, we need to undo the two types of differencing.
We start by replicating the bottom of the data in Figure 3 of SARIMA Model Example (i.e. the part that is not displayed) and then inserting the forecast that we obtained in Figure 1. This is shown in Figure 2.
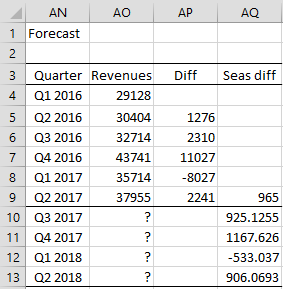
Figure 2 – Forecast (step 1)
We only need to go in the original time series far enough to produce at least one value not forecasted in column AQ. Whereas differencing proceeds from left to right, integrating (i.e. undoing differencing) proceeds from right to left. If we know the values in cells AP5 and AQ9, we can obtain the value in cell AP9 using the formula =AP5+AQ9. Similarly, if we know the value in cells AO8 then we can calculate the value in cell AO9 using the formula =AO8+AP9 (where the value in AP9 was calculated previously).
In a similar way, we can obtain the value in cell AP10, using the formula =AP6+AQ10 and the value in cell AO10 using the formula =AO9+AP10. We highlight the range AO10:AP13 and press Ctrl-D to obtain the other three forecast values, as shown in Figure 3.
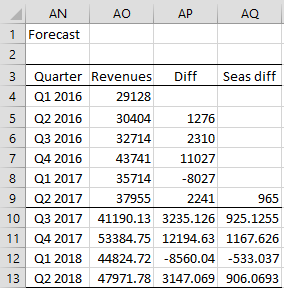
Figure 3 – Forecast (step 2)
Forecast Plot
We can now extend the plot shown in Figure 2 of SARIMA Model Example to include the forecasted values, as shown in Figure 4.
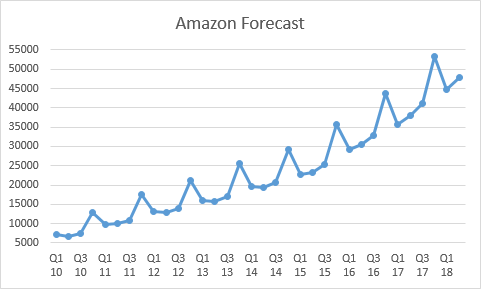
Figure 4 – Revenue Forecast
Examples Workbook
Click here to download the Excel workbook with the examples described on this webpage.
References
Greene, W. H. (2002) Econometric analysis. 5th Ed. Prentice-Hall
https://www.ctanujit.org/uploads/2/5/3/9/25393293/_econometric_analysis_by_greence.pdf
Gujarati, D. & Porter, D. (2009) Basic econometrics. 5th Ed. McGraw Hill
http://www.uop.edu.pk/ocontents/gujarati_book.pdf
Hamilton, J. D. (1994) Time series analysis. Princeton University Press
https://press.princeton.edu/books/hardcover/9780691042893/time-series-analysis
Wooldridge, J. M. (2009) Introductory econometrics, a modern approach. 5th Ed. South-Western, Cegage Learning
https://cbpbu.ac.in/userfiles/file/2020/STUDY_MAT/ECO/2.pdf
Hello Charles!
I have review prctically all your site and ITS GREAT!
I would like to know if you are going to develop SARIMAX model any time soon?
Best regards!
Hello Juan,
Thanks for your kind remarks about Real Statistics.
SARIMAX is on my list of things to do for this year. It won’t be in the next release, which I expect to issue shortly, but I hope to add it soon.
Charles
Charles
In determining the 0 and 1 inputs for p, d & q for arima and season, rather than becoming an expert in correlogram divination, one could use Solver with binary constraints function, if one knew what cell to minimize or maximize.
Since rmse has already been solved for (BTW, the SQRT function is missing on the example worksheets), what other cell could one use?
Hello Mark,
I often use MSE instead of RMSE and so don’t take the square root. If the goal is to minimize some expression, then the result will be the same.
I don’t know what you mean by “what other cell could one use?”
Charles
Charles
In the workbook examples for time series, on the SARIMA and SARIMA1 tabs, cell H15 is labeled “sqrt mse”, and cell I15 contains the formula “I10/I18”.
I think the SQRT function is missing from cell I15.
Mark
Charles
In the SARIMA time series tab, p,d & q inputs for arima and season are all 1. For the Amazon quarterly sales, this seems to be the best arrangement. But what if it is not? How would you optimize the p,d & q inputs? Could it be a second Solver solution or would it have to be part of the original Solver set up that is part of the data analysis tool? I assume in either case the cell to be optimized (minimized) would be mse?
Mark
Hello Charles, thank you for this beautiful mathematical set up. I downloaded the add in for my excel analysis. However, I have a couple of questions about the forecasting.
Since the tool does not explicitly give an option for SARIMA and Forecasting ( I only see ARIMA and forecasting) , after differencing to and seasonally differencing , can we still use the ARIMA and forecasting option to forecast our data?
2. Would you be able to kindly specify the parameters used for the formula for in figure 1 and perhaps why they were selected. I’m at that final hurdle and I’d love it if you could clear up that part for me.
Hello Jay,
1. The Real Statistics software does include a SARIMA data analysis tool for model building and forecasting. See
https://www.real-statistics.com/time-series-analysis/seasonal-arima-sarima/real-statistics-support-for-sarima/
2. The parameters were selected at random. I did not try to optimize the parameters. Elsewhere I have shown how to select the ARIMA model parameters.
Charles
Hi Charles,
Thank you for this content. I am testing this SARIMA model for forecasting and have 3 full years of history by week (so 156 historical datapoints). I want to apply a (1,1,1) (1,1,1) with 52 seasonal periods, but I receive the error message “Input must have at least p+d+ (P+D+1)*m+2 rows of data”.
Can you explain this restriction?
If I fake a few more periods of datapoints, I can achieve this minimum count of rows and get the model to run. But I do not follow why this is necessary.
Hello Christian,
Sorry for the delayed response.
It looks like I have made a mistake in specifying the minimum sample size. According to the following reference, the minimum should be
p + q + P + Q + d + mD
https://robjhyndman.com/papers/shortseasonal.pdf
Based on the approach that I am using this is probably not exactly the correct formula (e.g. I allow overlap between the p and q terms). In any case, the minimum stated in the error message is not correct. I still need to research this to get the correct value. I will try to correct this in the next release of the Real Statistics software.
Thank you for catching this error.
Charles
I need to look into this further since I probably need a larger sample to handle the first
Charles
Hello Christian,
I have just published a new release of the Real Statistics software which reduces the required size of the sample for Sarima. It is still higher than the size described in the article I referenced in my last response. I plan to relook at ARIMA and SARIMA shortly to change the implementation, but for now, I have made a small improvement.
Charles