Worksheet Functions
Real Statistics Functions: The Real Statistics Resource Pack provides the following functions. R1 is a column range containing time series data and R2 is a column range containing the corresponding forecast. For the Diebold-Mariano test, a second forecast is contained in column range R3. Note that these arrays have the same number of rows and they cannot contain any non-numeric values.
ForecastError(R1, R2, type) = the error statistic of one of the specified types; type takes one of the following string values: me, mse, rmse, mae, mpe, mape, smape, u1, u2 (see Time Series Forecast Error).
Forecast_Error(R1, R2, lab) = a column array containing the error statistics: me, mse, rmse, mae, mpe, mape, smape, u1, u2 (see Time Series Forecast Error); if lab = TRUE then an extra column of labels is appended to the output (default FALSE).
DIEBOLD(R1, R2, R3, h, type) = the test statistic for the Diebold-Mariano test. h is the number of lags (default 0, which is equivalent to h = the cube-root of the number of elements in R1). type = 0 (default) for e2 error measurement and type = 1 for the |e| error measurement.
DMTEST(R1, R2, R3, h, type) = p-value for the Diebold-Mariano test where h and type are as for the DIEBOLD function.
HLN(R1, R2, R3, h, type) = the test statistic for the HLN test. h is the number of lags (default 0, which is equivalent to h = the cube-root of the number of elements in R1). type = 0 (default) for e2 error measurement and type = 1 for the |e| error measurement.
HLNTEST(R1, R2, R3, h, type) = p-value for the HLN test where h and type are as for the DIEBOLD function.
LossDiff(R1, R2, R3, type) = a column array containing the loss-differential time series for the Diebold-Mariano test with type as for the DIEBOLD function.
PESARAN(R1, R2) = the test statistic for the Pesaran-Timmermann test
PTTEST(R1, R2) = p-value for the Pesaran-Timmermann test
Examples
We can calculate the DM statistic in cell N8 and p-value in cell N9 of Figure 3 of Diebold-Mariano Test by the formulas
=DIEBOLD(A4:A23,B4:B23,C4:C23)
=DMTEST(A4:A23,B4:B23,C4:C23),
respectively (referencing the cells in Figure 1 of Diebold-Mariano Test). =LossDiff(A4:A23,B4:B23,C4:C23) produces the output shown in range H4:H23 of Figure 1 of Diebold-Mariano Test.
We can calculate the HLN statistic in cell N8 and p-value in cell N9 of Figure 3 of Diebold-Mariano Test by the worksheet formulas =HLN(A4:A23,B4:B23,C4:C23) and =HLNTEST(A4:A23,B4:B23,C4:C23), respectively (referencing the cells in Figure 1 of Diebold-Mariano Test).
The PT statistic in cell E11 and p-value in cell E12 of Figure 1 of Pesaran-Timmermann Test can be calculated by the worksheet formulas =PESARAN(A4:A18,B4:B18) and =PTTEST(A4:A18,B4:B18), respectively.
Data Analysis Tool
Real Statistics Data Analysis Tool: The Real Statistics Resource Pack supplies the Forecast Accuracy data analysis tool to determine the accuracy of a time series forecast or determine whether one forecast is better than another.
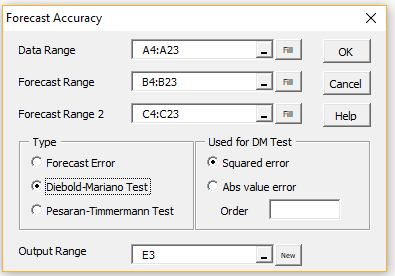
To use this tool, for example, to perform the analysis for Example 1 of Diebold-Mariano Test, press Ctrl-m and select the Forecast Accuracy option from the resulting menu (or Time S tab if using the Multipage interface). Now fill in the dialog box that appears as shown in Figure 1.
Figure 1 – Forecast Accuracy dialog box
The Order field is left blank to get the default, which, as we have seen, will be set to 4. The output will be similar to that shown in Figures 1 and 3 of Diebold-Mariano Test.
Results
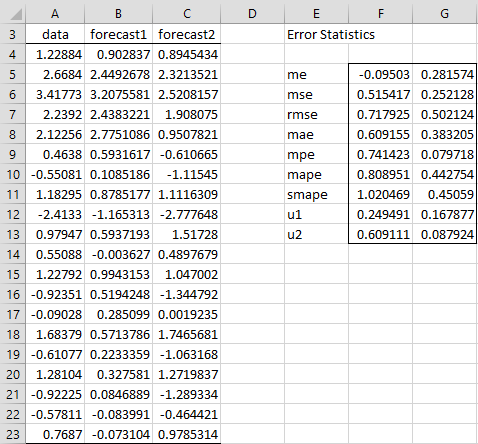
If we select the Forecast Error option in Figure 1, then we would get the output shown in Figure 2.
Figure 2 – Error statistics
Despite the fact that we found no significant difference between the two forecasts using the Diebold-Mariano and HLN tests, we see from Figure 2 that the MSE statistic is considerably smaller for Forecast 2 than Forecast 1 (as are all but the ME error statistic).
Note that range E5:F13 contains the worksheet array formula =Forecast_Error(A4:A23,B4:B23,TRUE) and range G5:G13 contains the array formula =Forecast_Error(A4:A23,C4:C23). You can get the same results for column G by placing =Forecast_Error(A$4:A$23,C$4:C$23,E5) in cell G5, highlighting the range G5:G13 and pressing Ctrl-D.
Examples Workbook
Click here to download the Excel workbook with the examples described on this webpage
References
Hyndman, R. J. and Athanasopoulos, G. (2018) Evaluating forecast accuracy. Forecasting: Principles and Practice. 2nd ed.
https://otexts.com/fpp2/accuracy.html
Oracle (2018) Time-series forecasting error measures
https://docs.oracle.com/en/cloud/saas/planning-budgeting-cloud/pfusu/time-series_forecasting_error_measures.html
Triacca, U. (2016) Lesson 19: comparing predictive accuracy of two forecasts: the Diebold-Mariano test.
https://docplayer.net/21167781-Lesson19-comparing-predictive-accuracy-of-two-forecasts-th-diebold-mariano-test.html
Pesaran, M. H. and Timmermann, A. (1992) A simple nonparametric test of predictive performance. Journal of Business & Economic Statistics, Vol. 10, No. 4, pp. 461-465
https://www.jstor.org/stable/1391822

