Objective
The Pesaran-Timmermann test determines whether a forecast does a good job of predicting the change in direction of a time series. I.e. its directional accuracy.
Test Description
For any time series ti with n elements, we first define
Now, suppose we have a time series yi with n elements which is forecasted by zi and define
![]()
Under the null hypothesis that z does not forecast the direction of the change in y (i.e. the sign of yi), we have the following test statistic
The Pesaran-Timmermann test is a one-tailed test in which the critical region (where the null hypothesis is rejected) is the upper tail of the standard normal distribution. Thus if
1 – NORM.S.DIST(PT, TRUE) < α
then we can reject the null hypothesis and state with 1–α confidence that the forecast accurately predicts the sign of yi.
Note that if the sign of all the elements in yi (or zi) are the same, then the PT statistic will be undefined.
Example
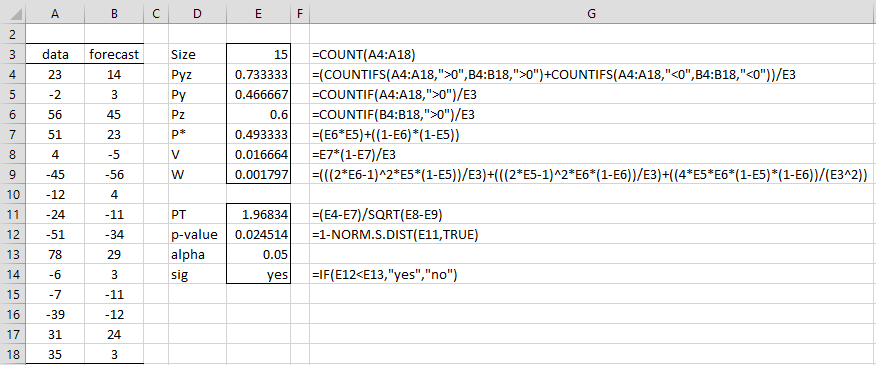
Example 1: Use the Pesaran-Timmermann test to determine whether the forecast in column B of Figure 1 accurately forecasts the direction of change for the data in column A.
Figure 1 – Pesaran-Timmermann Test
The test gives evidence that the forecast does accurately forecast the direction of change in the data.
Real Statistics Support
Click here for information about Real Statistics support for the Pesaran-Timmermann test.
Examples Workbook
Click here to download the Excel workbook with the examples described on this webpage
References
Pesaran, M. H., Timmermann, A. (1992) A simple nonparametric test of predictive performance. Journal of Business & Economic Statistics, Vol. 10, No. 4 (Oct. 1992), pp. 461-465
https://www.jstor.org/stable/1391822
Cook, S. (2014) Directional forecasting, forecasting accuracy and making profits
https://www.economicsnetwork.ac.uk/showcase/cook_directional

