Basic Concepts
Using a simple moving average model, we forecast the next value(s) in a time series based on the average of a fixed finite number m of the previous values. Thus, for all i > m

Example
Example 1: Calculate the forecasted values of the time series shown in range B4:B18 of Figure 1 using a simple moving average with m = 3.
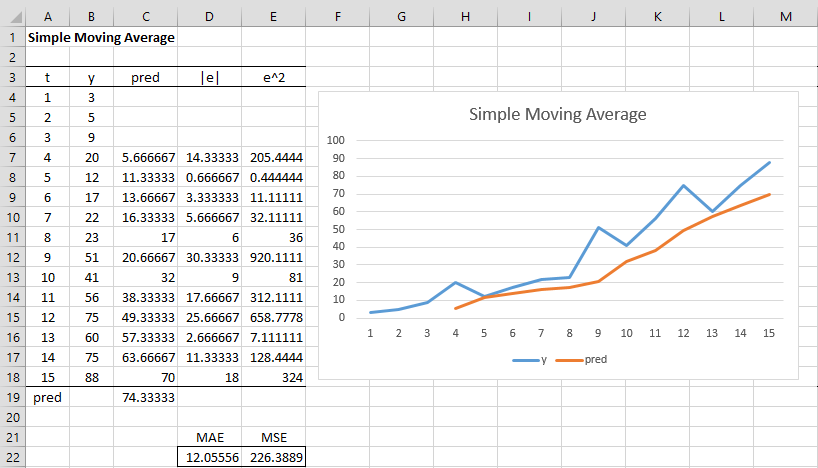
Figure 1 – Simple Moving Average Forecast
To produce the values on the left side of Figure 1, insert the formulas =AVERAGE(B4:B6), =ABS(B7-C7), and = (B7-C7)^2 in cells C7, D7, and E7 respectively, and then highlight the range C7:E18 and press Ctrl-D.
The values for MAE (cell D22) and MSE (cell E22) are then calculated using the formulas =AVERAGE(D4:D18) and =AVERAGE(E4:E18), respectively. Alternatively, these values can be calculated using the formulas
=SUMPRODUCT(ABS(B7:B18-C7:C18))/COUNT(B7:B18) =SUMXMY2(B7:B18,C7:C18)/COUNT(B7:B18)
We next highlight the range B3:C18 and select Insert > Charts|Line to create the chart on the right side of Figure 1. Note that the chart of forecasted values (pred in red) smooths out the chart of y values (in blue). The higher the value of m, the more smoothing that occurs.
Note that we can forecast the next value in the time series (cell C19) as 74.33, by using the formula =AVERAGE(B16:B18).
Excel Data Analysis Tool
Excel Data Analysis Tool: Excel provides the Moving Average data analysis tool to simplify the calculations described above.
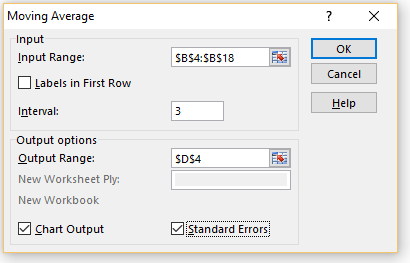
To use this tool for Example 1, select Data > Analysis|Data Analysis and choose Moving Average from the menu that appears. Fill in the dialog box that appears as shown in Figure 2.
Figure 2 – Moving Average dialog box
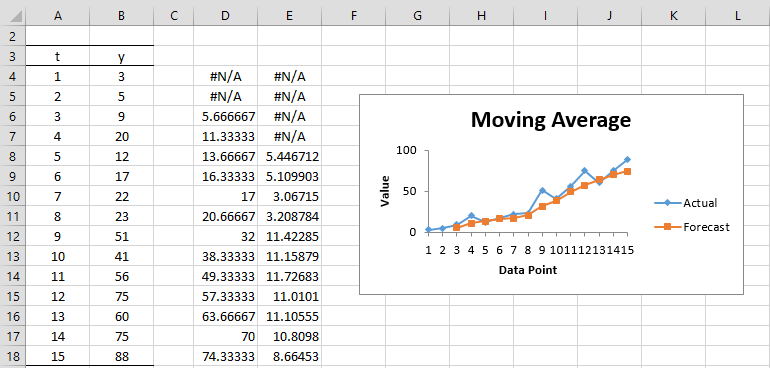
The output is shown in columns D and E of Figure 3 along with the chart.
Figure 3 – Moving Average data analysis
In this version of the model, the forecast is shifted left by one time unit. In fact, the chart compares yi with ŷi+1. Note that the forecast for the first m–1 time periods is #N/A.
This model also adds a standard error, which can be calculated by inserting the formula =SQRT(SUMXMY2(B6:B8,P6:P8)/3) in cell Q8, highlight the range Q8:Q18 and press Ctrl-D. Note that the s.e. values for the first 2m–2 time periods are #N/A.
The original approach has the forecasted values lagging behind the original values. The Excel approach corrects this somewhat (at the cost of not being able to directly predict the value for i = 16).
Note too that if the Intervals field in Figure 2 is not filled in, it defaults to 3.
Real Statistics Data Analysis Tool
Real Statistics Data Analysis Tool: The Real Statistics Resource Pack also provides a Simple Moving Averages data analysis tool.
To use this tool for Example 1, press Ctrl-m and select Basic Forecasting from the Time S tab. (If using the original user interface, press Ctrl-m and select Time Series from the dialog that appears. Select the first option from the dialog box that appears as shown in Figure 4.)
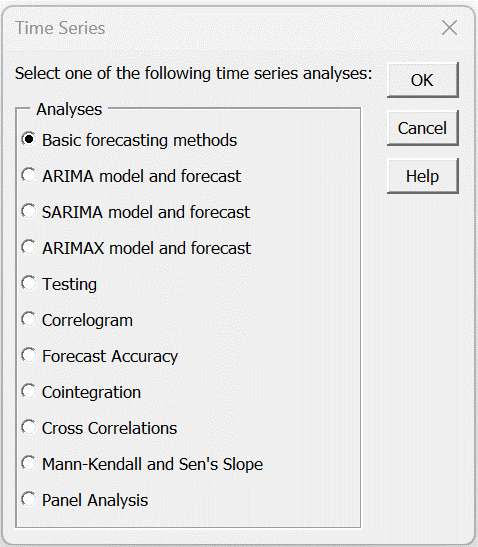
Figure 4 – Time Series dialog box
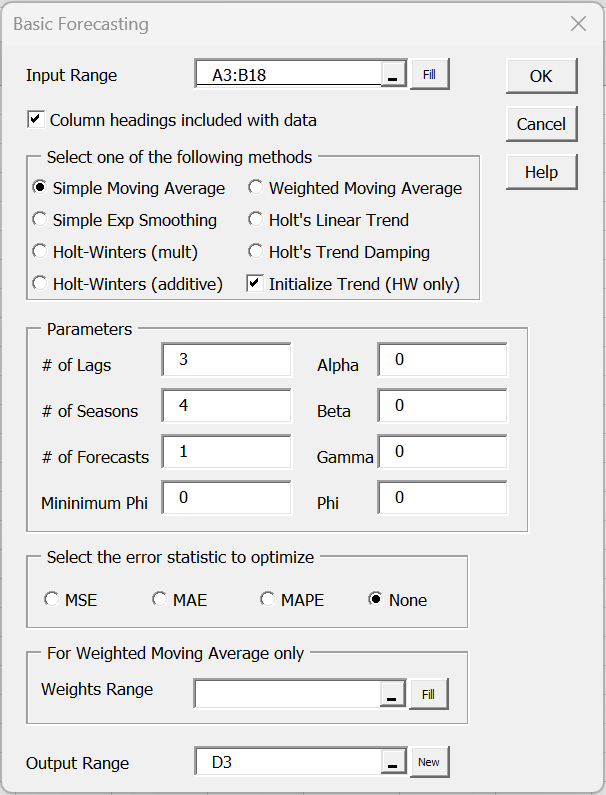
Now fill in the dialog box that appears as shown in Figure 5 (most of the values displayed are the defaults).
Figure 5 – Forecasting dialog box
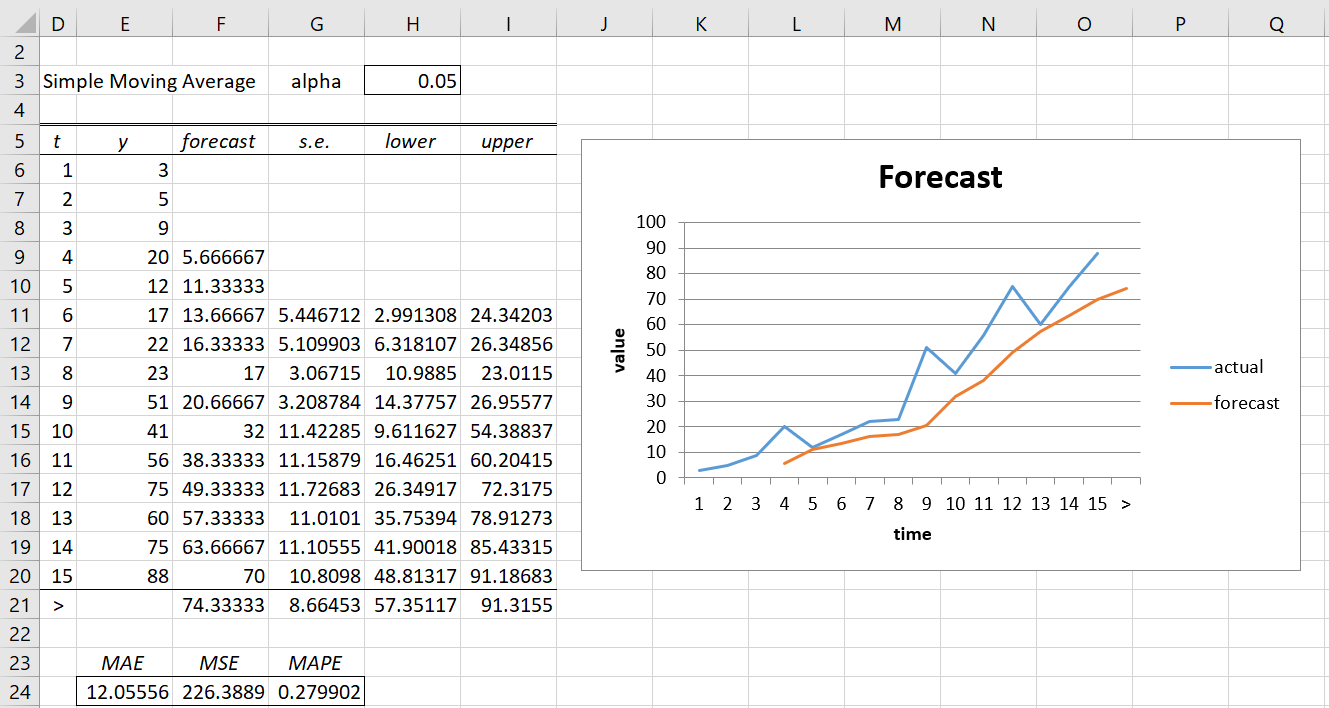
When you click the OK button, the output shown in Figure 6 will appear.
Figure 6 – Simple Moving Average data analysis
The value in cell F21 is the forecast at time 16.
Dialog Box Options
Note that you can optionally omit the time values from the input (i.e. by inserting only B3:B18 in the Input Range in Figure 5). In this case, the output will only contain two columns (i.e. the t column won’t appear in Figure 6).
The Alpha, Beta, Gamma, Phi, # of Seasons, # of Forecasts, Weights Range, and optimization fields in Figure 5 are not used for simple moving averages.
Note that the standard error values are the same as for the Excel data analysis tool. The 95% prediction interval is also displayed in Figure 6. E.g. cell H21 contains the formula =F21-G21*NORM.S.INV(1-H$3/2) and cell I21 contains =F21+G21*NORM.S.INV(1-H$3/2). Thus, the 95% prediction interval is (57.35, 81.32).
You can change the alpha value to get any 1-alpha prediction interval that you choose.
Examples Workbook
Click here to download the Excel workbook with the examples described on this webpage
References
Hyndman, R. J., and Athanasopoulos, G. (2018) Moving averages. Forecasting: principals and practice, 2nd Ed.
https://otexts.com/fpp2/moving-averages.html
Cheusheva, S. (2023) Calculating moving average in Excel
https://www.ablebits.com/office-addins-blog/moving-average-excel/
ExcelTip (2023) Moving average in Microsoft Excel
https://www.exceltip.com/tips/moving-average-in-microsoft-excel.html
Hi Charles,
Great post as usual.
What is the advantage of this method if I know the real values already?! I can only predict one future reading/value. So would it be considered a real forecasting method?
Hi CR,
It is a real forecasting tool, but it is probably more useful as a smoothing tool. I would tend to use Holt Linear Trend, Holt-Winters or ARIMA instead.
Charles
Hi, looking at the chart, how do i forecast the next 5 months, i do have actual data from Jan to May, but at the time of May, how do i forecast my sales for the 5 month
Hi Billy,
Using this forecasting approach the forecast for each successive month is the same as the first month forecasted.
For this reason, perhaps simple moving average isn’t the right forecasting tool for your needs.
Charles
Hi Charles,
Why do we calculate E^2 in simple moving averages, when we have actual and absolute value of prediction – E ?
Thanks
Hi Heera,
When you refer to E^2 are you referring to the squared errors (or sum of the squared errors, SSE, or mean squared error, MSE)?
There are a number of commonly used measures of the error of a prediction. The most commonly used such measure is the squared error. The mean absolute error is also commonly used.
Charles
Thanks Charles for your prompt reply.
E^2 values help in drawing the graph of linear trend. The excel program considers these values in preparing the graph.
data series: 3 years on a monthly basis, monthly sales. when I do the forecasting it gives me as a result up to one month later.
if i want 4 months after the last survey?
Valerio,
This approach assumes that all future forecasts are flat, i.e. maintain the same value. No seasonality is assumed. You probably need to use some other forecasting technique that takes the trend and/or seasonality into account.
Charles
Hello Charles
Congratulations on the site.
Please, I have a question about the confidence intervals, if you want to predict more than one step ahead. How do I correct the variance to predict confidence intervals one step further?
Fabiano,
The Real Statistics website addresses this issue for exponential smoothing, Holt’s trend and Holt-Winters. This issue is addressed for Simple Moving Average at https://people.duke.edu/~rnau/411avg.htm, but without giving a formula.
Charles
Thanks Charles
Hi Charles,
Your website has been very useful to me. It is a jewel!
I have a doubt. I’m self-studying time series and I’m confused with the different approaches that some authors take to describe this method. I don’t know if there is a difference between moving averages as a forecasting technique and as a smoothing method.
In the online notes of a Applied Time Series Analysis course by PennState University (https://online.stat.psu.edu/stat510/lesson/5/5.2) a distinction between a “centered moving average” (If we want a “centered moving average of length 3” with equal weights would be the average of values at times t-1, t and t+1) and a “one-sided moving average” (the one that I think you’re describing) is made. I’ve been reading multiple sources and some of them, the one’s that are using the method to make forecast (for example Business Forecasting by Hanke & Wichern), use the one sided approach and there are other that use the centered moving average as a smoothing tools to better see patterns in Time Series (for example Practical Business Statistics By Spiegel, Statistics for business and economics by Newbold, Carlson and Thorne).
What is the difference between this two ways of applying Moving Averages? The one sided approach is better for forecasting?
Alejandro,
Moving averages can be used for smoothing as well as for forecasting. The mathematics is identical.
For example, often in the news in the past few months are the 7-day moving averages for Covid cases or Covid deaths. This uses smoothing. Since there can be some daily fluctuation in the numbers (especially on Sundays when the values seem to be under-reported), it can be beneficial to hide a little of the details so that the overall trend is clearer.
Moving averages can also be used for forecasting, although there are usually better techniques for doing this.
You have stated the difference between centered moving average and one-sided moving averages quite well. In the end, the graphs are the same: the only difference is the label on the graphs.
The one-sided moving average is more appropriate for forecasting since the centered moving average would require that you already had some future data (the t+1 values).
Charles
Oh! Now I see.
Than you for your response, Charles! I’m very grateful.
hello, can you help me develop a time series data with the use of moving average method?
Hello Veronica,
I don’t understand your question. You can use the simple moving average approach with any time series.
Charles
Hello Charles,
How can I predict say the 50th value. For instance, I have the following values, using Moving Average, how do I predict the value of TONS in the year 2050.
YR TONS
2004 57
2005 72
2006 41
2007 70
2008 72
2009 92
2010 81
2011 81
2012 67
2013 94
2014 79
2015 92
2016 96
2017 91
2018 58
This approach only gives a forecast for 2019.
You can continue to forecast for 2020 by using the forecasted value for 2019 as if it were data. You can continue in this manner until 2050, but I wouldn’t count on the forecast value being very accurate.
Charles
Is there any statistical method I can use to predict the valuse of Tons in 2050?
There are many options E.g. Holt-Trend (or Holt-Winters if there is seasonality) or ARIMA. All of these are described on the Real Statistics website and supported by the Real Statistics software.
Charles
Hi Charles,
How do you calculate the confidence interval for the moving average?
Good question. I will add this information to the webpage in the next day or two.
Charles
Thank you Charles. Looking forward to see it.
Sir,
Thank You for your wonderful clarity with which you teach. I have two doubts,
1. how to obtain the detrended value moving average.
2. whose method of initialising values for Holt-Winters you have used.
Hello Asha,
1. This approach doesn’t take trend into account. If there is a trend you should use Holt’s Linear Trend. See
Holt’s Linear Trend
2. There are many initializing approaches. I simply start the calculations after enough days (or time units) to take the average of the correct number of values). This is a common approach.
Charles
Is moving Average part of exponential smoothing methods?
Lala,
Exponential smoothing is the same as exponential moving average. See Exponential Moving Average.
Charles
Apologies if this is too basic a question Charles but how does one predict say the 16th, 17th value?
Do I assume the future to be flat or keep on computing averages of last 3 observations?
Thanks,
Sourik
Sourik,
Either approach could be reasonable. I would continue to take the moving average using forecasted values after the last data point.
Charles
Apologies if I’m misunderstanding, but where you say:
“To produce the values on the left side of Figure 1, insert the formulas =AVERAGE(C4:C6)…”
Should it not be =AVERAGE(B4:B6) as column B contains the actual values?
Mike,
Yes, you are correct. Thanks for catching this typo. I have now made the correction on the webpage. Thanks for helping improve the accuracy of the webite and making it easier for people to understand.
Charles
Hi Charles,
Your website is very useful 🙂
I am a novice and have one question: how do you decide on ”m” value? I have 22 months of historical sales data and need to forecast 12 months of sales. If I use m=3 it means in month 4 my forecast would be based purely on the previous forecast so what value of ”m” should I choose?
Thank you
Julia,
Glad you are getting value from the website.
There is no right or wrong value for m. It really depends on why you want to use a moving average approach in the first place. The larger the value of m, the more the resulting graph will be smoothed. Usually the value of m is determined based on the specific domain in which you are operating, and so it depends on your specific domain-knowledge.
Charles
Charles,
Given the examples you provided, it looks to me like the correct expression for the SMA would be to either divide the summation by m, or each individual number within it, but not both. Am I correct?
Jonathan,
You are correct.
Charles
How to get Real Statistics Data Analysis Tool from Excel? Thank you
See Free Download
Charles
Dear Mr Charles
How do we calculate forecast for period 17? do we put forecast p-1 into y?
Please advice
Ade,
Yes, you could use the forecast value as data. Don’t expect that forecasts that are more than a few steps into the future will be very accurate.
Charles