Example using Real Statistics
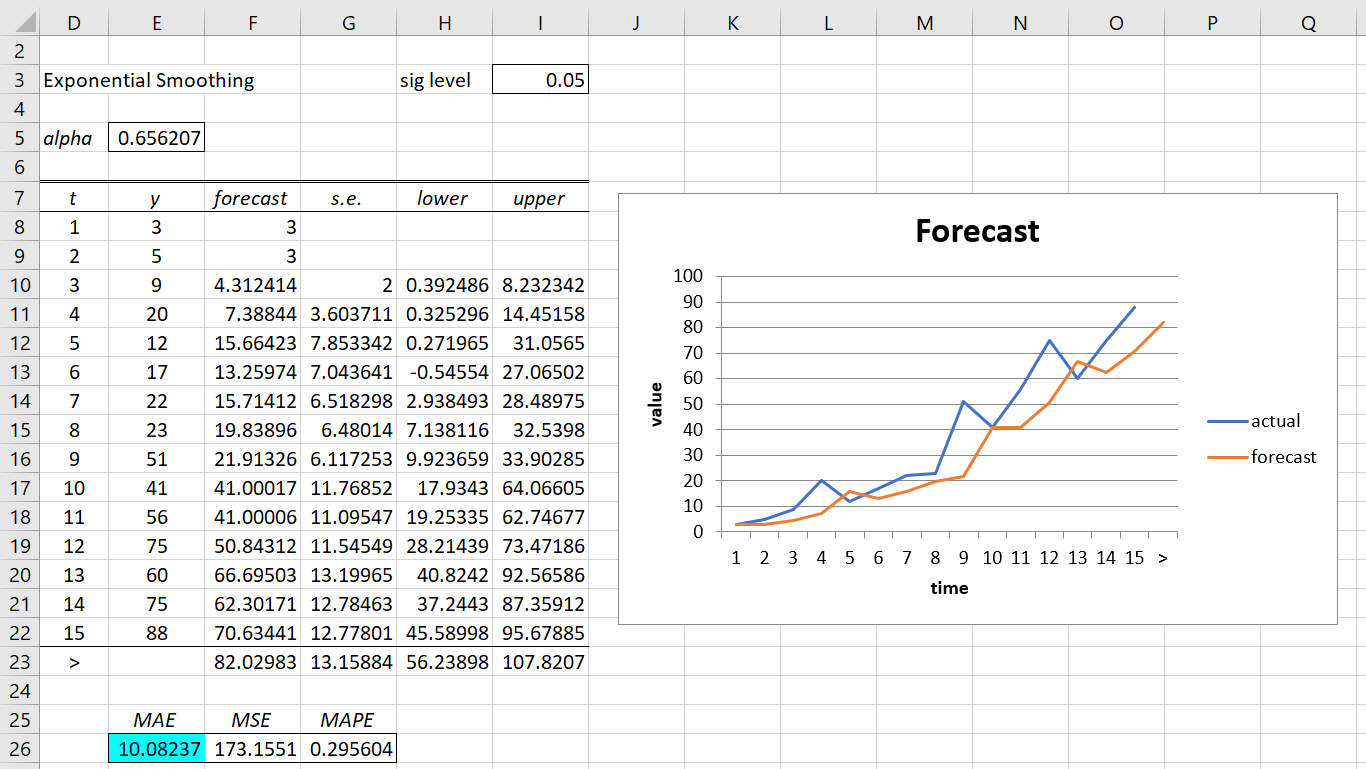
Example 1: Use the Real Statistics’ Basic Forecasting data analysis tool to get the results from Example 2 of Simple Exponential Smoothing.
Press Ctrl-m and select the Basic Forecasting option from the Time S tab. Fill in the dialog box that appears as shown in Figure 4 of Simple Moving Average except that this time choose the Simple Exp Smoothing option and MAE optimization (and so Real Statistics will automatically select the alpha parameter that optimizes the MAE value). Note that for Example 1 of Simple Exponential Smoothing, we would specify Alpha to be .4 and set the optimization option to None.
After clicking on the OK button, the output shown in Figure 1 appears.
Figure 1 – Exponential Smoothing data analysis
Standard Error and Confidence Interval
Note that the standard error for the forecast at time t = n is given by the value
Thus, cell G23 contains the formula
=SQRT(SUMXMY2(E$9:E22,F$9:F22)/COUNT(F$9:F22))
You can also copy this formula into all the cells in range G10:G22. The 1-α confidence interval of the prediction is calculated by ŷ ± se · zcrit where zcrit = NORM.S.INV(1-α/2). E.g. the worksheet formula in cell H23 is =F23-G23*NORM.S.INV(1-I$3/2).
Note that 95% confidence intervals are displayed. You can change these to any other confidence interval by changing the value in cell I3 (e.g. insert .01 in I3 to obtain 99% confidence intervals).
Advanced Forecast
Figure 1 only provides a one-period-ahead forecast. If you require further forecast periods, they are all equal to the value shown in cell F23. The standard error would increase though. For k periods ahead the standard error would be
where se1 is the one period ahead standard error. Thus for t = 17, the forecasted value is 82.02983 with a standard error of
![]()
Examples Workbook
Click here to download the Excel workbook with the examples described on this webpage
Reference
Nau, R. (2014) Forecasting with moving averages. Fuqua School of Business, Duke University
https://www.academia.edu/28074627/Notes_on_forecasting_with_moving_averages_Robert_Nau


Hello,
I am looking for deriving exponential moving average(EMA) as described in
https://en.wikipedia.org/wiki/Moving_average#Exponential_moving_average
First of all, is it possible? considering you have sets of 200 data points and want to derive 50EMA, 100EMA and 200EMA.
Thanking you,
Thanks for your comment. I will consider providing additional information about this topic.
Charles
Thank you Charles,
If possible please notify the same to me …
Regards,
Hello, just a brief question.
When you compute the standard error on your example on Figure 1, I’ve noticed that you haven’t taken the first row t=1 (cells E8, F8) into account, instead you started the SUM and COUNT functions on cells E9 and F9. Shouldn’t it be from cells E8, F8 on? Is this a mistake or the first row (t=1, E8) shouldn’t be considered? From the standard error equation it seems to me that it should be from row 8 on, but I’m not sure.
Thank you for your answer, it’s being very helpful.
Hello Martina,
The first row consists of setting the prediction to the sample value. This is one way to initialize the system. Since there is no error in the first row, it seems best to start with the second row. This is also what Excel does. See
https://www.real-statistics.com/time-series-analysis/basic-time-series-forecasting/simple-exponential-smoothing/
Charles
I see it now, thank you so much for your clarification Charles