Data Analysis Tool
Real Statistics Data Analysis Tool: Excel doesn’t provide data analysis tools for Holt’s Linear Trend or the Holt-Winters methods. Instead, you can use the Real Statistics data analysis tool to perform these (as well as the analysis for the Simple Exponential Smoothing method).
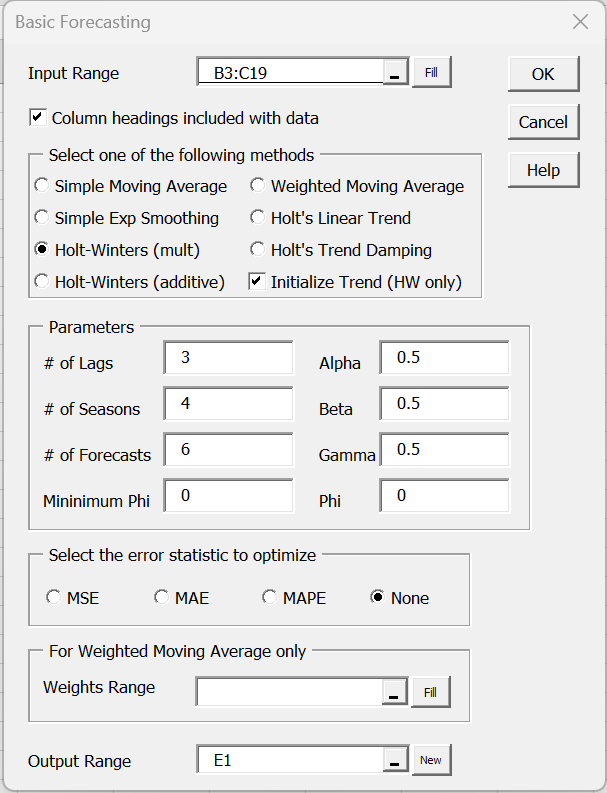
To use this tool for Examples 1 and 2 of Holt-Winters Multiplicative Method, press Ctrl-m and choose the Basic Forecasting option from the Time S tab (or from the Time Series option if using the original user interface). Now, fill in the dialog box that appears as shown in Figure 1, selecting the Holt-Winters (mult) option, clicking on the Optimize None checkbox, setting the appropriate values for Alpha, Beta, and Gamma, and choosing 4 quarters in the # of Seasons and 6 in the # of Forecasts fields. Also, make sure the Initialize Trend option is selected.
Figure 1 – Forecasting dialog box for Holt-Winters
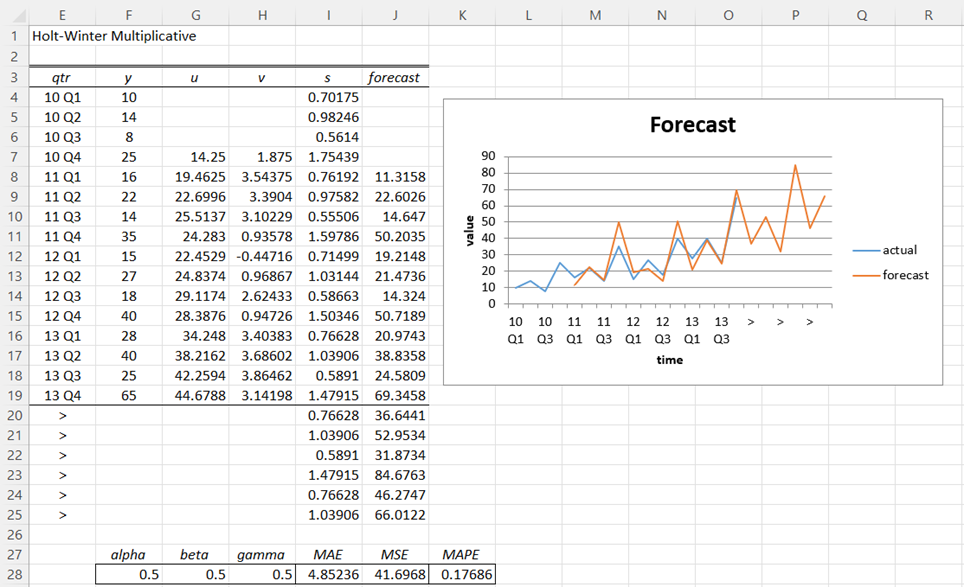
After clicking on the OK button the output in Figure 2 is displayed.
Figure 2 – Holt-Winter’s data analysis
Note that the formula in I21 is =I17 and the formula in cell J21 is
=($G$19+$H$19*(ROW(G21)-ROW($G$19)))*I21
The output displays the symbol “>” for the forecasted times on the x-axis of the Forecast chart. To get the correct time values you need to manually replace the symbol “>” in range E20:E25 with the values 14 Q1 through 15 Q2.
Options
Note the following about the Basic Forecasting data analysis tool (see Figure 1). The Input Range contains one or two columns (if two, then the first column contains the time labels). The # of Lags parameter is only used with the Simple Moving Averages option, the # of Seasons and Gamma fields are only used with the Holt-Winters options, the # of Forecasts and Beta fields are only used with the Holt’s Linear Trend and Holt-Winters options (the others methods default to one forecast value) and the Alpha parameter is used with the Single Exponential, Holt’s Linear Trend and Holt-Winters options.
The Weights Input Range is only used with the Weighted Moving Averages option. This range should contain values that add up to one and should not include a column heading.
Optimizing Parameters
The Basic Forecasting data analysis tool can also be used to find optimal values of the Alpha, Beta, and Gamma parameters when using Simple Exp Smoothing, Holt’s Linear Trend, or Holt-Winters options. This is done by clicking on the MSE (default), MAE, or MAPE radio button. The data analysis tool uses Solver to find the parameter values that minimize the value of the selected MSE, MAE, or MAPE error statistic.
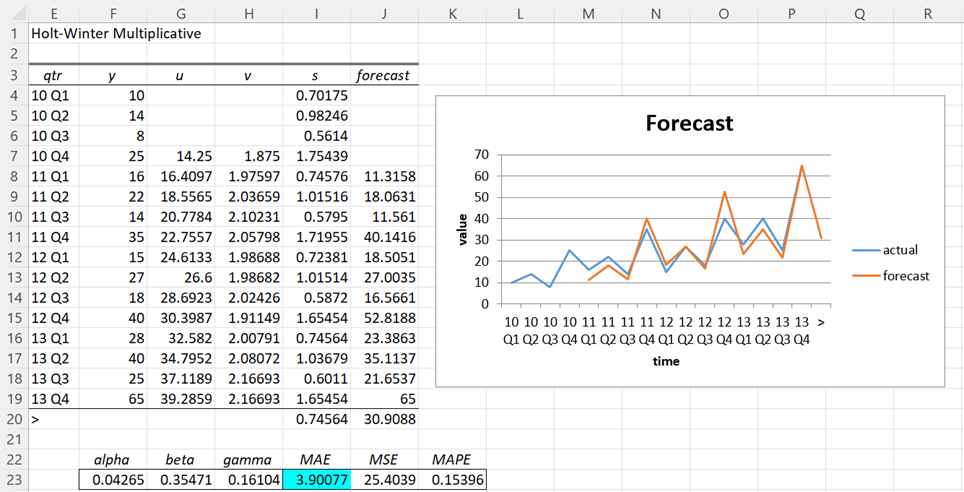
For example, if we fill in the dialog box as shown in Figure 1, except that we click on the Optimize MAE checkbox and use the default values of zero for Alpha, Beta, and Gamma and one for # of Forecasts, we get the output shown in Figure 3.
Figure 3 – Optimized Holt-Winter’s Forecast
Optimization Approach
The Real Statistics data analysis tool uses the approach described in Holt’s Trend Confidence Interval. More specifically, the data analysis first calculates MAE for all values of alpha, beta, and gamma between 0 and 1 in increments of .0125. Once it finds the values of alpha, beta, and gamma that produce the smallest MAE value, it then uses Solver based on these initial values to further optimize the value of MAE.
Optimization for the Additive Method
The results for Example 1 of Holt-Winters Additive Method shown in Figure 1 on that webpage were obtained using the Basic Forecasting tool. This was done by filling in the dialog box as shown in Figure 1, except that the Holt-Winters (additive) and Optimize MSE options were chosen, and the # of Forecasts was set to 4.
Examples Workbook
Click here to download the Excel workbook with the examples described on this webpage.
References
Hyndman, R. J., and Athanasopoulos, G. (2018) Exponential smoothing. Forecasting: principals and practice, 2nd Ed.
https://otexts.com/fpp2/expsmooth.html
Ravinder, H. V. (2016) Determining the optimal values of exponential smoothing constants – does Solver really work? American Journal of Business Education
https://files.eric.ed.gov/fulltext/EJ1054363.pdf


Charles,
I get the following error message from VB when I try to run RealStats: Runtime error 424. Object required. Basically the programmes don’t run on spreadsheets they used to run fine on. The debug option is greyed out. Have you ever come across this ? How can I get around it ?
Hi Dirk,
I have seen this error before, but the only way I can determine the cause is if you send me the spreadsheet data and tell me what you were trying to do. Also, it would be helpful if you tell me what you see when you insert the formula =VER() in any cell.
Charles
Charles,
Thanks for the reply.
I fixed it this morning. Solver would not run either in some of the sheets of the workbook. I traced it down through Perplexity AI and learned that Solver uses Active-X to some extent. By releasing the security level slightly of Active-X it all suddenly came right again: RealStats and Solver are working fine now. It remains strange because nobody touched the settings of Active-X to cripple these two add-ins…
Cheers,
Dirk
Dirk,
Thanks for updating me on the situation.
It does seem like a strange sequence of events caused the error. Glad that you were able to resolve things.
Charles
Hi Charles,
Thank you so much! Your software is of great help.
I have a very simple question as I am very new to HW. I am forecasting monthly leavers for 2025 using data from 2021–2024. I want to forecast the data by month, not by quarters. Should my settings be:
# seasons: 12 (one seasonal cycle of 12 months),
# forecasts: 12 (predicting 12 months)?
Are these values correct, or do they need adjustments?
Hi Shreya,
Your values are perfect if you have monthly data for 2021-2024 and you want to make 12 monthly predictions for 2025.
Charles
Thank you, Charles!
Dr. Zaiontz, I’m trying to replicate Figure 3 (which is in ‘Holt-Winters 4a’!$E$1 of Holt-Winters.xlsx). I’m following your instructions in the paragraph immediately above Figure 3. But my output from your Resource Pack doesn’t match Figure 3 and are instead:
alpha = 0.018698627
beta = 0.915692537
gamma = 0.153230643
MAE = 3.856554259
Hi Jim,
The values in Figure 3 are based on the older algorithm that I used. I need to update this figure with the figures from the new algorithm. These new figures are
alpha = 0.022766
beta = 0.738119
gamma = 0.154533
MAE = 3.864766
As you can see, these are still not the same as the figures you obtained. I see that your output is slightly better than mine. I know that the algorithm that I use won’t necessarily obtain the optimal solution, but usually it will be close. If you used the Real Statistics data analysis tool you should have gotten the exact same output as me. I don’t understand why there would be any difference. What do you see when you enter =VER() in any cell?
Charles
Ok @Charles, I’m using Excel 8.4 (version 2208 build 16.0.15601.20446) for Windows. Have you changed the algorithm since February 2nd? Today I downloaded Holt-Winters.xlsx again (‘Holt-Winters 4a’ worksheet matched Figure 3). I’m following your instructions in the paragraph immediately above Figure 3. However, your Resource Pack is optimizing better than your results in the above comment and are instead:
alpha = 0.0186986274320048
beta = 0.915692536651009
gamma = 0.153230642704083
MAE = 3.85655425863321
(Sorry Dr. Zaintz, please disregard my reply at 4:45 am because it repeats my original comment.) I’m using Excel 8.4 version 2208 build 16.0.15601.20446 for Windows. My original comment’s results are on the ‘Holt-Winters 4a’ worksheet, because Figure 3 matched that worksheet. However, your comment’s results used the ‘Holt-Winters 4’ (not 4a) worksheet.
I can replicate both results (in my comment and yours) by using the respective worksheets. As you noted, ‘Holt-Winters 4a’ worksheet optimized better than the ‘Holt-Winters 4’ worksheet. Both worksheets seem to share the same values for y (columns C) though!
Prof. Zaiontz, I’m trying Holt-Winters with monthly data. My parameters are below.
# of Lags: 0
# of Seasons: 12
# of Forecasts: 12
Intialize Trend: checkmark
Optimize: MSE
Output Range: E1
Excel shows a warning: “Objective cell must be a single cell on the active sheet.” When I click “ok” on that warning, why do the output’s entire column of “v” values become the same? Thanks.
Jim,
If you email me an Excel file with your data, I will try to figure out what is going on.
Charles
Hey
Could you please tell me what should be number of seasons if I have daily data (closing price) for 5 days a week and in my real stats I only get holt winters model not additive and multiplicative separately but i want to use the additive method so what should I change in the parameters.
Thank you
Hello Anshika,
If I understand correctly what you are doing, you would use a seasonal period of 5 (for 5 days a week).
I don’t understand your second question. Real Statistics supports both additive and multiplicative versions of Holt-Winters.
Charles
Hey
Everytime I try putting 5 as number of seasons it shows “run time error unable to set horizontal alignment”however it is functioning well with 4 seasons. Please tell me what I’m doing wrong.
Could you also tell me how do we determine the number of forecasts
Hello Anshika,
1. I just ran Holt-Winter with seasonality = 5 on some artificial data and it worked without producing an error.
I would need to see your data and the parameters that you entered to be able to say why you got the error.
2. The number of forecasts depends on how many (future) forecasts periods you need. This is completely a user determined value.
Charles
Dear Charles
I am receiving the message “Objective cell must be a single cell on the active sheet” when using holt-winters additive method (in real statistics). Am I doing something wrong?
Thank you very much.
No, not necessarily. This is a message from Excel’s Solver. I don’t know why it appears sometimes and not others, even when the Objective cell is a single cell. Just click on the OK button and everything will be fine.
Charles
I keep getting “Objective cell must be a single cell on the active sheet.” What am I doing wrong?
Mike,
Which Excel or Real Statistics tool are you using when you get this message?
Charles
can I use this method to predict the designation of the employee?
Hello Mithra,
Perhaps. It depends on the type of data you have.
Charles
Hi Charles,
What if my mse is greater number for example more than 1000. Should I consider the mse ?
Hemanth,
I don’t understand your comment. What is mse greater than?
Charles
Hey Charles
When I used Holt winters method and optimize the mse by clicking on the box. I’m getting the results MAE – 28.15 and MSE – 1427.2. I would like to know is this a good fit or not?
It is not possible to say based on these values.
Charles
Hi Charles,
what should I put in # of seasons if I have daily data? and if I have per hour data?
Lauren,
There are 24 hours in a day, and so you would use 24 as the # of seasons (assuming that you data for each of the 24 hours).
Charles
What do we fill in the # of lags, # of seasons, and # of forecast field if we are going to use the method that does not require them?
Te0,
You don’t need to change the values for any field that is not used.
Charles