Basic Concepts
The data in Figure 3 of Simple Exponential Smoothing (as well as previous figures on that webpage) shows a distinct upward trend. The Moving Average and Simple Exponential Smoothing methods don’t adequately model this, but Holt’s Linear Trend Method (aka Double Exponential Smoothing) does. This is accomplished by adding a second single exponential smoothing model to capture the trend (either upwards or downwards). The model takes the following form for all i > 1.
![]()
![]()
![]()
![]()
where 0 ≤ α ≤ 1 and 0 < β ≤ 1.
An alternative form of these equations is
![]()
![]()
![]()
![]()
where![]()
Note that if β = 0, then the Holt model is equivalent to the Single Exponential Smoothing model.
Example specifying parameter values
Example 1: Redo Example 1 of Simple Exponential Smoothing using Holt’s Linear Trend Method where α = .4 and β = .7.
The result is shown in Figure 1. Here the cell C4 contains the formula =B4, cell D4 contains the value 0, cell C5 contains the formula =B$21*B5+(1-B$21)*(C4+D4), cell D5 contains the formula =C$21*(C5-C4)+(1-C$21)*D4 and cell E5 contains the formula =C4+D4.
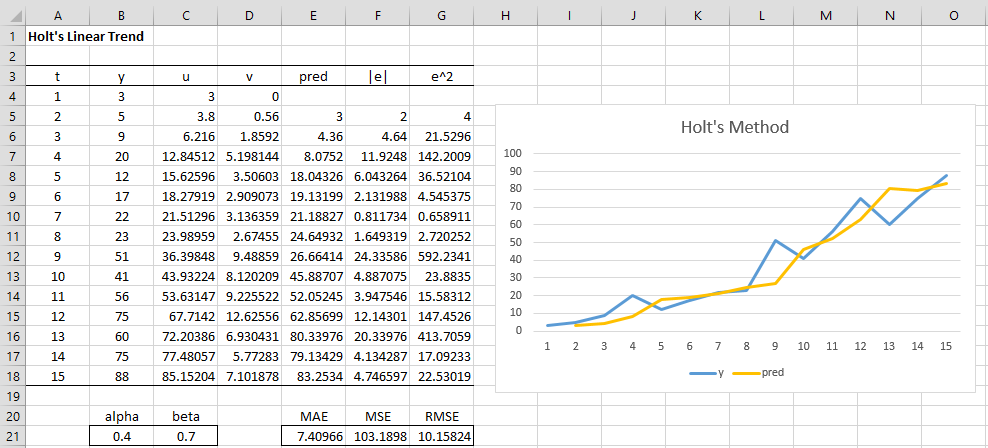
Figure 1 – Holt’s Linear Trend
Optimizing parameter values
Example 2: Find the best-fit Holt’s approximation to the data in Example 1, using the MAE measure of accuracy.
Using Solver, we minimize the value of MAE (cell E21 of Figure 2) by changing the value in range B21:C21 subject to the constraint that B21 <= 1.0 and C21 <= 1.0.
The result shown in Figure 2 is that α = .271817 and β = .598161, with MAE = 6.74.
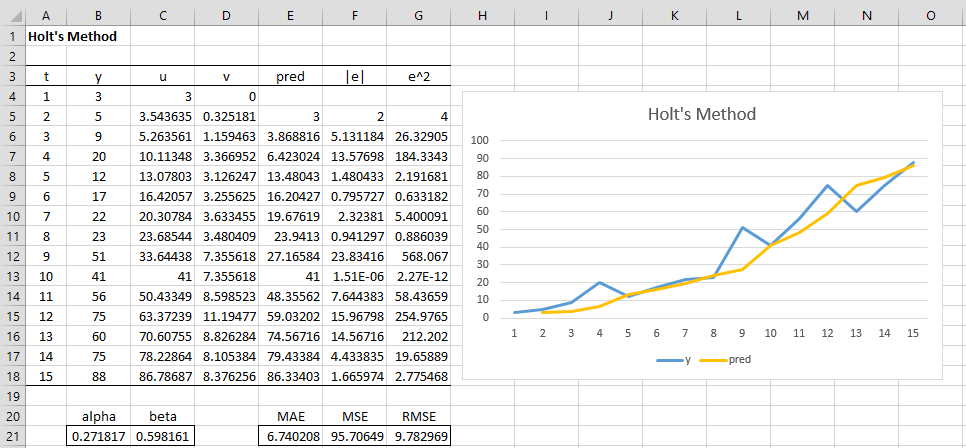
Figure 2 – Holt’s Method Optimized
Note that the optimization approach, described above, using Solver is susceptible to finding a local minimum instead of a global minimum. In fact, as we will see in Example 1 of Holt’s Trend Confidence Interval, we can obtain values for alpha and beta that yield a slightly lower MAE value.
Forecasting
For any value of i, the forecast at time i+h is given by the formula
![]()
Example 3: Forecast the next 5 values in the times series from Example 2.
The result is shown in Figure 3.
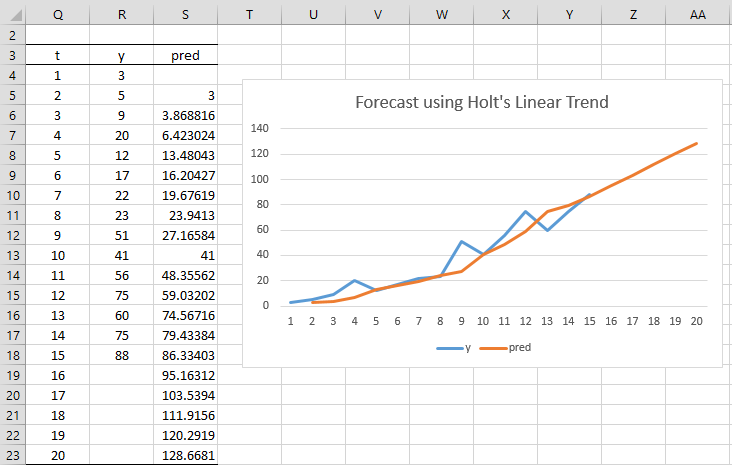
Figure 3 – Forecast using Holt’s Method
The y and predicted y values shown in Figure 3 for i = 1 to 15 are the same as shown in Figure 2. The next five values are shown in range S19:S23. E.g. to calculate that ŷ16 = 95.16312, we use the formula =C$18+(Q19-Q$18)*D$18. We get the other four values by highlighting the range S19:S23 and pressing Ctrl-D.
The graph on the right side of Figure 3 shows that the forecasted values after i = 15 are linear.
Confidence Intervals and Data Analysis Tool
Click here for an example of how to obtain the standard errors and confidence intervals for the forecast obtained via the Holt’s Linear Trend option of the Basic Forecasting data analysis tool.
Reference
Hyndman, R. J., and Athanasopoulos, G. (2018) Holt’s linear trend method. Forecasting: principals and practice, 2nd Ed.
https://otexts.com/fpp2/holt.html
Prof. Zaiontz,
Thanks for your article. Is there excel file for downloading referring to this calculation?
Hello Angela,
You an find the Excel spreadsheet for this calculation on the Time Series examples workbook at
https://real-statistics.com/free-download/real-statistics-examples-workbook/
Charles
Prof. Zaiontz, there may be a bug in the latest version of your Resource Pack (or I may be incorrectly using it). I’m trying to apply Example 2, except I want to start forecasting in year 4. However, the output seems to ignore the “# of Lags”.
In the Basic Forecasting dialog, my parameters are below.
Input Range: ‘Holt 3’!$B$3:$B$18
Method: Holt’s Linear Trend
# of Lags: 3
# of Seasons: 4
# of Forecasts: 4
Alpha: 0.4
Beta: 0.7
Optimize: MAE
Jim,
# of Lags parameter is only used with the Simple Moving Averages option. It is not used with the Holt’s Linear Trend option. See the following web page for more details:
https://www.real-statistics.com/time-series-analysis/basic-time-series-forecasting/real-statistics-forecasting-tools/
Charles
Hi, this might be a stupid question, but we did the eqaution quite different in Uni.
Can someone help me how to do the Bverton-Hault- Methode in Excel with this equation?
P(t+1)=(1,4/(1+(0,4/20)*P(t))*P(t))
with the Populations P1, P2, P3,P4, P5, P6, P7, P8, P9 P10 and inital value P(0)=5, P(0)=15 and P(0)=30
Is there someone who might can help me?
Thanks in advance!
Sorry, but I am not familiar with this method. Perhaps someone else can respond.
Charles
Thanks for your quick answer! I already figured it out 🙂
Hi charles,
Towards the end, you have stated y_(i+h) hat = u_i + v_i.
I did not follow this.
Shouldn’t the value of y_(i+1) continue to be calculated as u_i + v_i, that is y_(i+h) – u_(i+h-1) + v_(i+h-1)
Regards
Hi Sandeep,
Are you asking how to make predictions for more than one future period?
Charles
how we know choose appropriate where α and β ?
and second questions what the difference if we increase α and β ?
1. It depends on what your objective is. If you want to determine which values of alpha and beta reduce the mean squared error (MSE) or mean absolute error (MAE) between the predictions and the known values, then one approach is to minimize the error using Solver. This is explained in Example 2 on this webpage. More details about this approach are described at
https://www.real-statistics.com/time-series-analysis/basic-time-series-forecasting/weighted-moving-average/
2. I suggest that you increase and decrease the values of alpha and beta on the spreadsheet and see what happens to the error term.
Charles
What was the findings in all these questions? like what did you observe? can you share please?
Amit,
Sorry, but I don’t know what you are referring to.
Charles
Hi Charles,
How did you select the initial values of u and y for the Holt’s Linear Trend, and is it quite important?
You take u_1 = y_1 and v_1 = 0, but in some books I see it expressed as u_1 = y_1 and v_1 = y_2 – y_1, among other variations.
Thanks
Peter,
Yes, I use u_1 = y_1 and v_1 = 0. As you stated, other approaches are also used. For large time series this probably doesn’t matter much, but for smaller time series it might matter.
Charles
I think the Excel solution is a local optimum. I found a solution with MAE=6.5939 (alpha=0.21382, beta=0.86528).
Hello Erwin,
Yes, you are correct. Thank you for bringing this to my attention. I will need to look into how to create a better estimate.
Charles
i love this site .i am new in forecasting modelkng and know how to apply those all methods of forecasting but i need to know when to use which model for forecasting how would i know that any model is perfect for data ?
is there any cheat sheet is available or any link if yes please share
Thank you
Hello Muhammad,
Glad that you love the site.
Which model to choose depends on the nature of the data. To over-simplify, if your data doesn’t have a seasonal component, then you don’t need to use Holt-Winter. If the data doesn’t have trend (a tendency for the data to increase or decrease over time), then you don’t need to use Holt’s Linear Trend and can probably use Exponential Smoothing.
Charles
Hi Charles!
I’m trying to graph Error, Trend and Seasonality to decide which model I should use. The Udacity course I’m taking uses Alteryx, and those values are automatically plotted under decomposition plots. I know how to find error, but how would I get the values for trend and seasonality from a dataset? Does column c or d represent trend? Thanks so much for this amazing website, and all your answers!
Malak
Also, is the alpha value I get from using =forecast.est.stat in Excel the same as the alpha I get by using solver?
Malak,
I suggest that you try both of them and see.
Charles
Hello Malak,
I am pleased that you like the website. Thank you.
The u_i values represent the baseline, the v_i values represent the trend (i.e. slope). For seasonality, see
Holt-Winters
Charles
Hi Charles,
I am confusing if we do not have initial trend and initial level. Why should we simply use the first observation and the difference between the first two observations as starting level and trend?
William,
Sorry, but I don’t understand your question. These are the starting level and trend by definition.
Charles
Hello
I have two funny questions , recently I got a little confused
actually I want to ask :
1. Holt’s method is the same method as double exponential smoothing method?
2.Trends model and double exponential smoothing method are same?
I m doing a assignment so I must name the forecasting methods and explain them by their formula so I need some help 🙂
thank u
1. Yes, Holt’s method is the same method as double exponential smoothing method
2. Double exponential smoothing is a type of Trend model, but I don’t think they are equivalent. To me, a trend model is a linear regression model with one independent variable, namely time (or something similar), but I am not sure this is the definition used my everyone.
Charles
thank u dear
Hi Charles,
I am wondering, how do you gain the regression for both holt and winters models? I am currently doing an assignment on forecasting and I am just trying to wrap my head around why you need this regression and how you gain it.
Hello Charlie,
I don’t know what you mean by “gain”.
The goal is to create tools for forecasting using real-world data that has a trend.
Charles
Hello! Why it should leave a blank in first row of the column of the forecast?
Hello,
The predicted value at each time depends on the value at the previous time. The first row corresponds to time 1 (the first time period). Since there is no previous time, you can’t calculate a predicted time for the first row.
Charles
Hello Charles,
Please pardon my ignorance, am new in the “art” of forecasting. All solutions seem to be forecasting in the same period. What about, if being asked to build a model that will forecast sales for the NEXT two years using Holt winter method. How do I go about it?
Thanks
See Holt-Winter.
Charles
Hi Charles,
Sans Solver, how did the MAE, MSE and RMSE values came about? how are these calculated?
Miel,
As you probably know, calculating MAE, MSE, etc. doesn’t depend on Solver. Solver is used to optimize the alpha and beta parameters (to minimize MAE, MSE, etc.).
The following paper may be helpful in doing this without Solver:
https://files.eric.ed.gov/fulltext/EJ1054363.pdf
Charles
Great post Charles !
Could you tell me:
1.What are the acceptance criteria for the Holt’s model? I’ve read that some people use the RMSE / forecast value and if it’s less than 10%, you can use this model. In your example the model is not good for predictions 95,70649/95,16312=100,6%
2. what sould we minimize for having best α and β MAE, MSE or RMSE ?
Thanks !
Paul
Paul,
Glad you like the post.
1. The only real acceptance criteria for the Holt model (or any other model) is to see how good a job it does in correctly predicting future values. Even if the MAE, MSE or RMSE is very low, this only indicates that the model is a good fit for the existing (training) data. I don’t know of any universally agreed upon acceptable value for MAE, MSE, RMSE, etc.
2. Minimizing MSE is equivalent to minimizing RMSE. If you want to penalize larger errors then MSE is generally better than MAE, otherwise MAE is the better choice.
Charles
Thanks a lot Charles!
Dr. Zaiontz,
I am trying to build a similar spreadsheet table to validate Excel’s FORECAST.ETS function because I am a bit wary of the quality of the forecast.
1) I am wondering how this compares to Holt’s method
Your work is always exemplary and sets a high mark for other scientists to follow
2) Do you have either the Holt method or the ETA algorithm wks. in table form that you could email to me?
Respectfully,
Stephen Druley, Ph.D Theoretical Spatial Mathematics
Stephen,
1. I believe that FORECAST.ETS is supposed to be the same as Holt-Winter, although the algorithm used seems to be different.
2. See https://real-statistics.com/time-series-analysis/basic-time-series-forecasting/holt-winters-method/
See the following webpage to download a spreadsheet with an implementation of this algorithm:
https://real-statistics.com/free-download/real-statistics-examples-workbook/
Charles