Basic Approach
We now show how to calculate the coefficients of an AR(p) process which represents a time series by using ordinary least squares.
An AR(p) process can be expressed as
which is equivalent to
Our goal is to minimize
Let X be the n–p × p+1 matrix such that the ith row is [1 yi-1 yi-2 ⋯ yi-p], i.e. X = [xij] where xi1 = 1 for all i and xij = yi-j+1 for all j > 1. Let Y be the n–p × 1 column vector Y = [yp+1 yp+2 ⋯ yn]T, let φ be the p+1 × 1 column vector φ = [φ0 φ1 ⋯ φp]T and ε be the n–p column vector ε = [εp+1 εp+2 ⋯ εn]T . Then the AR(p) process can be represented by
Y = Xφ + ε
The least-squares solution φ = [φ0 φ1 ⋯ φp]T is then given by
φ = (XTX)-1XTY
Examples
Example 1: Use the least square method to find the coefficients of an AR(1) process based on the data from Example 1 of Finding AR(p) Coefficients.
The first 14 of 100 data elements are shown in column B of Figure 1. We next create the X and Y matrices as described above in ranges D5:E103 and G5:G103.
Figure 1 – Finding AR(1) coefficients using least squares
The coefficient matrix (range I5:I6) is then calculated using the array formula
=MMULT(MINVERSE(MMULT(TRANSPOSE(D5:E103),D5:E103)), MMULT(TRANSPOSE(D5:E103),G5:G103))
The predicted value in cell L5 is then calculated by the formula =I$5+K4*I$6 and similarly for the other values in column L.
Example 2: Use the least square method to find the coefficients of an AR(2) process based on the data from Example 2 of Finding AR(p) Coefficients.
Figure 2 – Finding AR(2) coefficients using least squares
The coefficient matrix (range J6:J8) is then calculated using the array formula
=MMULT(MINVERSE(MMULT(TRANSPOSE(D6:F103),D6:F103)), MMULT(TRANSPOSE(D6:F103),H6:H103))
The predicted value in cell M6 is then calculated by the formula =J$6+L5*J$7+L4*J$8 and similarly for the other values in column M.
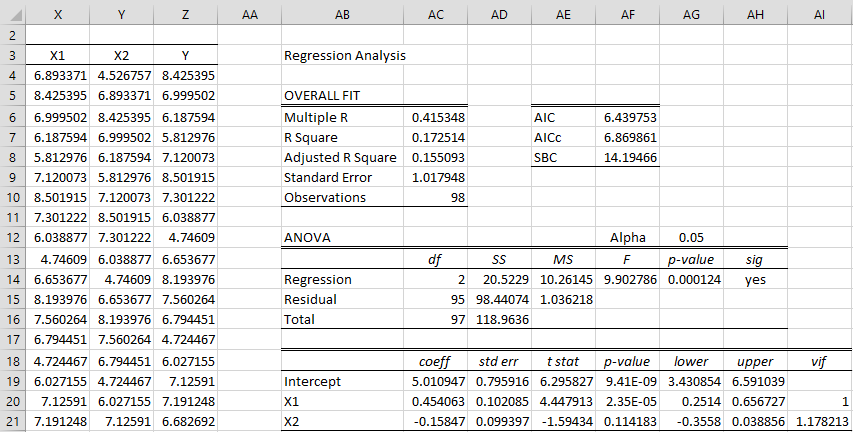
Of course, it is much easier to use the Real Statistics Linear Regression data analysis as shown in Figure 3.
Figure 3 – Regression approach to finding AR(2) coefficients
Here the X values are shown in columns X and Y and the Y values are shown in column Z. These values are obtained by placing the formulas =B5 (referencing Figure 2) in cell X4, =B4 in cell Y4 and =B6 in cell Z4, highlighting the range X4:Z101 and pressing Ctrl-D. The predicted values can now be calculated using the TREND array function.
Observation
The regression approach to calculating the AR(p) model coefficients is more accurate than the ACF/PACF approach described in Finding AR(p) Coefficients. Elsewhere we also show how to use Solver to calculate these coefficients. The coefficients will be identical to those using linear regression.
Worksheet Function
Real Statistics Function: The Real Statistics Resource Pack supplies the following array function:
ARMap(R1,p) – takes the time series in the n × 1 range R1 and outputs the n–p × p+1 range where the first p columns represent the X values in the linear regression and the last column represents the Y values.
If we highlight range X4:Z101, enter the formula =ARMap(B4:B103) and press Ctrl-Shft-Enter we would get the values shown in range X4:Z101 of Figure 3.
Examples Workbook
Click here to download the Excel workbook with the examples described on this webpage.
References
Wikipedia (2016) Autoregressive model
https://en.wikipedia.org/wiki/Autoregressive_model
Djellouli, A. (2024) Autoregressive (AR) models in time series analysis
https://adamdjellouli.com/articles/statistics_notes/time_series_analysis/autoregressive_models
Hamilton, J. D. (1994) Time series analysis. Princeton University Press
https://press.princeton.edu/books/hardcover/9780691042893/time-series-analysis


Hi Charles,
thank you for your explanations and examples, please note that Figure 1 and Figure 2 are switched.
Marco
Hello Marco,
Thanks for bringing this to my attention. I have just corrected the figures.
Charles
Hi Charles,
I’m performing a time series forecast of y with 3 independent x variables.
I wish to do this by regression and not drop the explanatory variables x and do an ARIMA
I have checked y for stationarity and the y time series is not stationary. In turn i have made it stationary by log or log differencing.
Now when I perform the regression to find the coefficients of x, do I do this on log (y) time series? And I do I need to do anything with the x variables or just leave them as they are?
Thanks
Jay
Please also note that my x variables are a set of published forecasted variables so e.g. I have the forecasted values for the next 5 time periods.
Jay,
You don’t need to transform these variables.
Charles