Basic Concepts
Suppose that we believe that an AR(p) process is a fit for some time series. We now show how to calculate the process coefficients using the following techniques: (1) estimates based on ACF or PACF values, (2) using linear regression and (3) using Solver.
We illustrate the first of these approaches on this webpage. The second is described at Finding AR(p) Coefficients using Regression, and, finally, the third is explained at Calculate ARMA(p,q) Coefficients using Solver.
For approach 1, we use the Yule-Walker equations in reverse to calculate the φ0, φ1, …, φp, σ2 coefficients based on the values of μ, γ0, …, γp (ACF values). Alternatively, we can use the values μ, γ0, π1…, πp (PACF values), which it turns out are equivalent.
Essentially, this is the method of moments.
AR(1) Example
Example 1: Use the statistics described above to find the coefficients of the AR(1) process based on the data in Example 1 of Autoregressive Processes Basic Concepts.
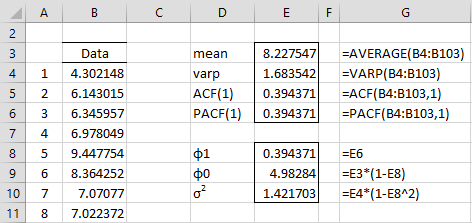
The first 8 of 100 data elements are shown in column B of Figure 1. We next calculate the mean, variance and PACF(1) values. From these, we can estimate the process coefficients as shown in cells G8:G10. This estimate of the time series is the process yi = 4.983 + .394yi-1 + εi where σ2 = 1.421703.
Figure 1 – Estimation of AR(1) coefficients
As we can see, the process coefficients are pretty close to the original coefficients used to generate the data in column B (φ0 = 5, φ0 = .4 and σ2 = 1) with the exception of σ2, which is a little high.
Observation
We can use this approach for AR(2) processes, by noting that
and so![]()
Alternatively, we could use the following equivalences:
AR(2) Example
Example 2: Use the statistics described above, to find the coefficients of the AR(2) process based on the data in Example 1.
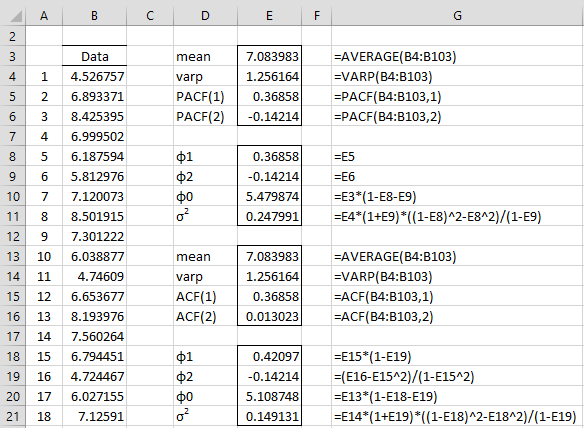
We show two versions in Figure 2. The lower version is based on the ACF using the formulas described in the above observation. The upper version is based on the PACF using Property 1 of Partial Autocorrelation of AR(p) Processes.
Figure 2 – Estimation of AR(2) coefficients
Estimate of σ2
When using the method of moments approach to estimating the AR(p) coefficients, we can estimate the variance of the error terms via the following formula:
where s2 is the usual expression for the variance of the time series
From the above, we see that for AR(1)
Examples Workbook
Click here to download the Excel workbook with the examples described on this webpage.
References
Wikipedia (2016) Autoregressive model
https://en.wikipedia.org/wiki/Autoregressive_model
Djellouli, A. (2024) Autoregressive (AR) models in time series analysis
https://adamdjellouli.com/articles/statistics_notes/time_series_analysis/autoregressive_models
Hamilton, J. D. (1994) Time series analysis. Princeton University Press
https://press.princeton.edu/books/hardcover/9780691042893/time-series-analysis


First, I’m sorry sir, I have commented too much. introduce me Deka from Indonesia
What about searching for AR (3)?
because i see in excel about AR 3 seems different. in the name sheet AR 4
Hello Deka,
I am not aware of any native Excel support for AR 3 or AR 4. What are you referring to?
Charles
In my previous post, dont know if it was published or not, I asked what the actual estimate of yi is given yi = 4.983 + .394yi-1 + εi where σ2 = 1.421703.
In this PDF from Wharton, slide number 7, they illustrate an example of how to forecast an ARMA model given AR1 and MA1 coefficents. In this example, they use the same estimated parameters for 3 forecasts, how do I use the formula in the upper paragraph to obtain an estimate like the one in the PDF? (attached below)
Also, thank you for an awesome website.
http://www-stat.wharton.upenn.edu/~stine/insr260_2009/lectures/arma_forc.pdf
Hi Viktor,
Glad you like the website. I plan to add a lot more information about time series and econometric modelling in the future.
See my previous response and the following webpage:
https://real-statistics.com/time-series-analysis/arma-processes/forecasting-arma/
Charles
Great excel sheet and great page! I’m wondering, what would the final estimate be?
In the text it says, yi = 4.983 + .394yi-1 + εi . However, according to a PDF from wharton university, it says that the AR estimate is a constant value?
Thank you!
Hi Viktor,
Once you know the value of some of the yt you can calculate the values of future yt using the equation, and so these values will be a constant. E.g. suppose that your time series consists of the values y1, y2, …, y40 and y40 Is 10. Then the forecasted value for 41 can be calculated as follows (setting ε41 = 0): y41 = 4.983 + .394(10) = 8.923.
Charles
hi sir..
in figure 1, u shows 8 of 100 data elements. by any chance, where can i get the 100 data elements?.
Muhammad,
You can get the complete data by going to the following webpage and downloading the appropriate Excel workbook.
https://real-statistics.com/free-download/real-statistics-examples-workbook/
Charles