In Calculating ARMA(p,q) Coefficients using Solver we showed how to create an ARMA model for time series data. We now present some statistics for evaluating the fit of the model. All the statistics we present will be for the ARMA(1,1) model created in Example 2 of Calculating ARMA(p,q) Coefficients using Solver.
Descriptive Statistics
We start with some descriptive statistics, as shown in Figure 1 (with reference to the cells in Figure 4 of Calculating ARMA(p,q) Coefficients using Solver).
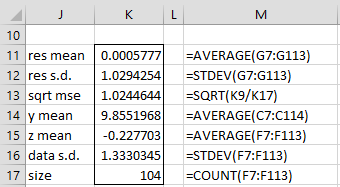
Figure 1 – Descriptive statistics
We see that the mean of the residuals (cell K11) is approximately zero, as we expect. The values in cells K12 and K13 provide estimates of σ2. The values of 1.024 and 1.029 are reasonably close to the expected value of 1.
The value y̅ (cell K14) is expected to be
![]()
which is reasonably close to the calculated value of 9.855. The value of z̅ is expected to be zero (since zi = yi – µ).
Finally, note that since |φ1| = .751 < 1, the ARMA(1,1) process is causal. Also since |θ1| = .486 < 1, the ARMA(1,1) process is invertible.
Comparison with other models
We created an ARMA(1,1) model for the data in Example 2 of Calculating ARMA(p,q) Coefficients using Solver), but how do we know that some other model, e.g. an ARMA(2,1) or ARMA(2,2) model, isn’t a better fit? Just as we have done for logistic regression, we seek the model with the smallest value for -2LL, but just as we have done for linear regression, we want to penalize models that have more parameters, favoring those with the fewest parameters, as long as the -2LL value (or equivalently the SSE value) is made as small as possible.
Akaike’s Information Criterion (AIC) and Bayesian Information Criteria (BIC) are two such measures. The latter is also called the Schwarz Bayesian Criterion (SBC) or the Schwarz Information Criterion (SIC).
![]()
![]()
![]()
![]()
![]()
where k = the number of parameters in the model, which for a model without a constant term is k = p + q + 1 (including φ1, …, φp, θ1, …, θq, σ); in the case where there is a constant term, k = p + q +2 (also including φ0).
The value of -2LL is as described at the end of Calculating ARMA(p,q) Coefficients using Maximum Likelihood. Since any models of the time series have the same n + nLN(2π) portion of -2LL, and therefore of AICaug and BICaug, these values are not relevant, and so can be left out of the definitions of AIC and BIC.
For the time series in Example 2 of Calculating ARMA(p,q) Coefficients using Solver), the values of these statistics are shown in Figure 2.
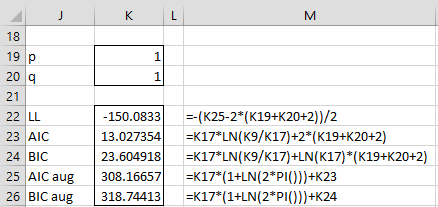
Figure 2 – AIC and BIC
Significance of the coefficients
We now test whether each of the coefficients φ0, φ1, θ1 makes a significant contribution to the value of LL. We use the same approach as we use for logistic regression (see Comparing Logistic Regression Models). If we have two models one with all the coefficients and another where one coefficient is removed, then we can test whether the LL values of the two models are significantly different by using the fact that LL1 – LL0 ~ χ2(1) where LL1 is the LL value for the complete model and LL0 is the LL value for the reduced model.
For ARMA(p,q) models, this is equivalent to testing
![]()
where SSE0 and SSE1 are the sums of the squared errors of the reduced and complete models respectively. The results for Example 2 are shown in the upper portion of Figure 3.
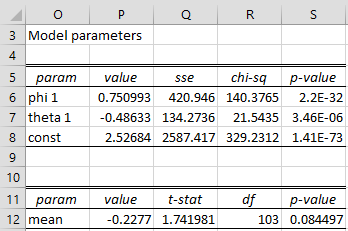
Figure 3 – Significance of model coefficients
The values in cells P6, P7 and P8 are equal to the values in cells J6, K6 and J7 of Figure 4 of Calculating ARMA(p,q) Coefficients using Solver. The SSE value in cell Q6 (i.e. the SSE value where the φ1 coefficient is dropped from the model) is calculated using the Real Statistics worksheet formula =ARMA_SSE(F6:F110,P6,P7,0,1). Similarly, cell Q7 contains =ARMA_SSE(F6:F110,P6,P7,0,,1) and cell Q8 contains =ARMA_SSE(F6:F110,P6,P7,K7). See the description of ARMA_SSE below.
Cell R6 contains the formula =K17*(LN(Q6)-LN(K9)) and cell S6 contains the formula =CHISQ.DIST.RT(R6,1), and similarly for cells R7, S7, R8 and S8. The p-values indicate that all these coefficients result in a significant difference in LL values.
The test of the theoretical z-mean value of -0.2277 (cell P12) is the usual t-test. The p-value of 0.084497 indicates that the theoretical z-mean is not significantly different from zero.
Worksheet Function
Real Statistics Function: The Real Statistics Resource Pack provides the following array functions. In particular, the first is used to calculate the ARIMA coefficients used in creating the ARIMA model and their standard errors.
ARMA_SSE(R0, R1, R2, avg, p1, q1) = SSE value for the time series data in R0 based on the p phi coefficients in R1 and q theta coefficients in R2; also the p1th phi coefficient is zeroed out and/or the q1th theta coefficient is zeroed out; finally the mean is zeroed out if avg is set to a non-zero value.
In Real Statistics ARMA Tool we show a different approach to evaluating the model coefficients, namely the one that is usually employed.
Examples Workbook
Click here to download the Excel workbook with the examples described on this webpage.
References
Pelgrin, F. (2011) Methodology of Box-Jenkins
https:// https://math.univ-cotedazur.fr/~frapetti/CorsoP/Chapitre_52_IMEA_1.pdf
Triacca, U. (2014) Estimation of the parameters of an ARMA model
No longer available online
Hamilton, J. D. (1994) Time series analysis. Princeton University Press
https://press.princeton.edu/books/hardcover/9780691042893/time-series-analysis
Hitchcock, D. (2016) Specification of example time series
https://people.stat.sc.edu/hitchcock/stat520ch6slidespart2.pdf
Pakwashi, R. (2020) The ARMA model and model selection criteria
https://sme-water.co.uk/the-arma-model-and-model-selection-criteria/
Hello,
I am trying to figure out which forecast is better? I am using your ARIMA and the Holt Winters additive. I am using MAPE for Holt but how do I create a MAPE when the forecast column in ARIMA are the actual in the starting data. Do I used the Forecast Reduced data? I calculate the MAPE there and it gives me like 2.87 which seems VERY high. Is the MAPE/MAE/MSE the value I should be using to compare? Thanks in advance!
Hello Tade,
Generally you compare MAPE, MAE, or MSE values (or RMSE which is the score root of MSE).
These are described at
https://real-statistics.com/time-series-analysis/forecasting-accuracy/time-series-forecast-error/
Often a penalty is imposed for more parameters using AIC or BIC or HQC. See the following for more information:
https://www.researchgate.net/publication/313991989_Evaluating_and_Comparing_Forecasting_Models
https://openforecast.org/adam/statisticalTests.html
Charles