On this webpage, we demonstrate how to find the coefficients of an ARMA(1,1) process using Solver.
ARMA(1,1) w/o Constant
Example 1: Assuming that the time series data in Example 1 of ARMA(1,1) Processes (duplicated in range F8:F112 of Figure 1) can be represented by an ARMA(1,1) process, use Solver to find the φ1 and θ1 coefficients.
Since the time series data in Example 1 simulates the ARMA(1,1) process
with σ2 = 1, it is not surprising that we can model the time series as an ARMA(1,1) process. We now see how close the coefficients are to the coefficients of the original ARMA(1,1) process.
Since we are assuming that we have an AR(1,1) process, we know that
Solving for the residual, we have
We will assume for the moment that φ0 = 0.
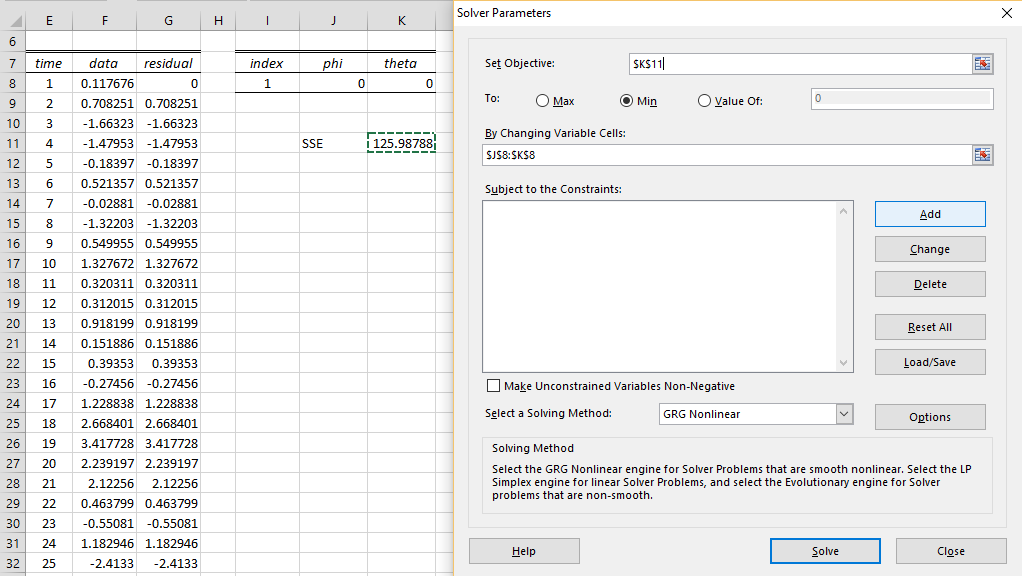
Place 0 in cell G8 and the worksheet formula =F9-SUMPRODUCT(F8,J$8)-SUMPRODUCT(G8,K$8) in cell G9. Then highlight the range G9:G112 and press Ctrl-D. Here J8 contains the initial guess for φ1, namely zero and K8 contains the initial guess for θ1, also zero.
Actually, it is sufficient to use the formula =F9-F8*J$8-G8*K$8 in cell G9. We use the more complicated formula shown above since it is applicable when we get to the general ARMA(p,q) case.
Figure 1 – Using Solver to find the coefficients
As described in Calculating ARMA Coefficients using Maximum Likelihood, we need to find the values of φ1 and θ1 that minimize the sum of the squared errors (SSE), εi, which is modeled using the formula =SUMSQ(G9:G112) in cell K11. We now use Solver to minimize the value in cell K11.
Using Solver
Select Data > Analysis|Solver and fill in the dialog box that appears as shown on the right side of Figure 1. When you press the Solver button, the values in cells J8 and K8 will change to those that appear in Figure 2.
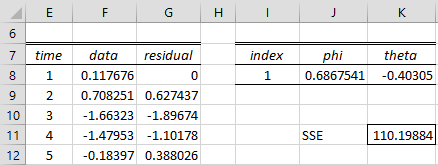
Figure 2 – Solver output
We see that the values φ1 = .6867541 and θ1 = -0.40305 reduce SSE from 125.98788 to 110.19884. These are the coefficients we are looking for. Note that the phi coefficient is fairly similar to the original coefficient φ1 = .7, and the theta coefficient is a little off from the original coefficient θ1 = -0.2.
T-Test
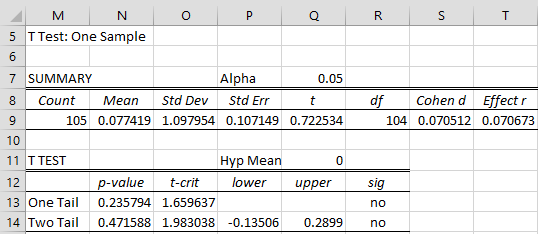
We can use the Real Statistics T Test and Non-parametric Equivalents data analysis tool, to determine whether the mean of the data values (in range F8:F112) is significantly different from zero.
Figure 3 – Testing the constant term
As we see from Figure 3, the mean is not significantly different from zero, which justifies the assumption that we made earlier to set φ0 = 0.
ARMA(1,1) with Constant
Example 2: Assuming that the time series data in Example 2 of ARMA(1,1) Processes can be represented by an ARMA(1,1) process, use Solver to find the φ1 and θ1 coefficients.
Since the time series data in Example 2 simulates the ARMA(1,1) process
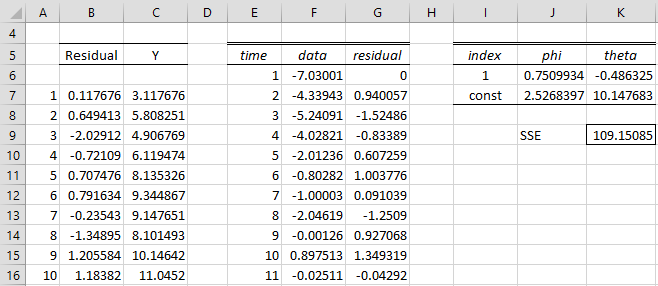
i.e. the same process as in Example 1, except that the constant term is non-zero. Repeating the steps described in Example 1 (with a few differences, as described below), we get the output from Solver shown in Figure 4 (only the first 10 data elements are displayed).
Figure 4 – Solver output for ARMA(1,1) process with constant term
The data in columns B and C are the same as in Figure 2. Whereas column C contains the original time series data yi, column F contains the data for the time series zi = yi – µ. This is done by placing the formula =F6-K$7 in cell F6, highlighting the range F6:F110 and pressing Ctrl-D. Here cell K7 contains the estimate of the mean of the ARMA(1,1) process which is being estimated.
As in Example 1, now place 0 in cell G6 and the formula =F7-SUMPRODUCT(F6,J$6)-SUMPRODUCT(G6,K$6) in cell G7. Then highlight the range G7:G110 and press Ctrl-D. We also insert the formula =SUMSQ(G7:G110) in cell K9 (SSE).
Using Solver
We now use Excel’s Solver to minimize the value of SSE. The Solver dialog box is filled in as in Figure 1, except that this time we insert K9 in the Set Objective field and the range J6:K7 in the By Changing Variable Cells field, where J6 contains the initial guess for φ1, namely zero and K6 contains the initial guess for θ1, also zero, K7 contains the initial guess for µ, namely 0, and J7 contains the value of φ0, which is calculated by the formula =K7*(1-SUM(J6)) since as we saw in defining ARMA(p,q) processes in ARMA Basic Concepts
Note that we could simply use the formula =K7*(1-J6) in cell J7 in the ARMA(1,1) case, although the more complicated formula given above is applicable in the more general ARMA(p,q) case.
After clicking on the Solve button, the output shown in Figure 4 is displayed. You can see that the estimated values of φ0, φ1, θ1 are similar, but not exactly the same as the original values of the simulated ARMA(1,1) process.
Examples Workbook
Click here to download the Excel workbook with the examples described on this webpage.
References
Pelgrin, F. (2011) Estimation of ARIMA models
https://math.univ-cotedazur.fr/~frapetti/CorsoP/Chapitre_4_IMEA_1.pdf
Triacca, U. (2014) Estimation of the parameters of an ARMA model
No longer available online
Hamilton, J. D. (1994) Time series analysis. Princeton University Press
https://press.princeton.edu/books/hardcover/9780691042893/time-series-analysis
Hitchcock, D. (2016) Parameter estimation in time series models
https://people.stat.sc.edu/Hitchcock/stat520ch7slides.pdf


Hi Charles,
In regard to using Solver, suppose I was using log differences of data, say, ln[sales(t)/sales(t-1)], may I minimize directly the SSE of the forecast sales(t) = exp(forecast ln[sales(t)/sales(t-1)] and actual sales, instead of minimizing the SSE between the forecast and actual log differences,? I thought logically I should get the same results, but I tried it and got different results. Would you know why?
Hi Bong,
Probably because it isn’t an increasing function.
Charles
Hi Charles
I want to ask you
As we know, to get the error value that will be used for forecasting the MA model, the error is obtained by the difference between the actual data and the forecast data.
so, to predict the first time how do we get the error?
Hi Dea,
Are you asking how to determine the residual for the first time period?
Charles
Hi Charles,
Hope you are keeping well.
I would have to agree with some of the other comments on this page about some of the problems being encountered using Solver here. As per figure 4, you have a formula in cell J7 and it’s suggested to set the Objective field and the range as J6:K7. When running solver, it will override the formula. I tried this using excel in Microsoft 365. Solver does produce the same phi and theta but the constant terms don’t change and the J7 formula is overridden.
If you have any suggestions, I would appreciate it. Look forward to hearing from you.
kind regards
Declan
Hi Charles,
What I did to solve the problem is by changing the variable cells to not include J7 and then it works.
kind regards
Declan
Hi Declan,
The values to change are J8:K8, not J6:K7. You need to include the phi coefficient in cell J8.
Charles
Thanks Charles 🙂
Hi Declan,
The values to change are J8:K8, not J6:K7.
Charles
Dear Sir.Charles,
I am trying to make Markov Switching Autoregressive model in excel.
Can you give me some idea about AR with regime, plz?
I am so confused.
Thank you.
Hello Charles,
cheers to the nice work on the web, add-in and examples!
I have been facing similar issues as others before. Could you please comment on the following?
1. Why is \mu (theta_const) being calculated? Looking at the definition of ARMA(1,1), it seems that there is not a unique solution as there are two constants in the model, i.e. \mu and \phi_0.
2. Formula in cell J7 = K7*(1-J6) is always overridden (hard-coded) by Excel’s Solver once you select the range J6:K7 as your coefficients. Maybe, it would be useful if you could add snapshot of your Solver setup as my Solver also does not converge to the optimal solution you are showing.
Thanks a lot,
Pavol
Pavol,
1. There is only zero or one constant (the phi_0 term). What is \mu?
2. There is no formula in J7. Perhaps you mean J8. There is no formula in that cell either. Range J8:K8 doesn’t contain any formulas; their values are set by Solver. They are initially set to zero (or any value you choose). What values do cells J8 ad K8 converge to?
Charles
Charles –
Sorry, I should have mentioned that I am referring to Example 2, i.e. ARMA with constant. \mu = µ
I was also referring to the paragraph saying:
[…] except that this time we insert K9 in the Set Objective field and the range J6:K7 in the By Changing Variable Cells field, where J6 contains the initial guess for φ1, namely zero and K6 contains the initial guess for θ1, also zero, K7 contains the initial guess for µ, namely 0, and J7 contains the value of φ0, which is calculated by the formula =K7*(1-SUM(J6)) […]
Pavol,
Thanks for the clarification.
1. There are three coefficients phi_0, phi_1 and theta_1. The constant term, aka the intercept, is phi_0. If you know the value of mu then the value of phi_0 is determined and similarly, if you know the value of phi_0 then mu is determined.
2. The formula in J7 is not overridden, just its value. As you have noted, any change in the value of K7 results in a change in the value of J7.
Charles
Dear Charles,
In Figure 4, column F, why did you deduct the average form the Y values instead of deducting Phi0 (cell J7)? That is what I would imagine since you are trying to isolate the residual ei to later minimize SSE. I have tried that but I got different coefficients values, far away from the model.
Thanks a lot,
Andre
Andre,
The two methods should yield the same results. If you send me an Excel file with your data and results, I will try to figure out what is happening.
Charles
Dear Charles,
I was experiencing similar issue as Daniel reported above and I have managed to reach the same result only when I added a constraint K7>9. Actually, in a different situation (not related with Real Statistics using Excel), I was also having trouble with Solver trying to calculate GARCH(1,1).
This seems strange. Not clear why you would need to add the constraint.
Charles
Hi,
In the second example, with a constant term, my solver does not reach the same solution as yours.
My initial parameters are all 0 as you sugest in the text.
I keep getting Phi1 = 1.000066, Theta1 = -0.48633, ThetaConst = -1080.60.
I have manually inserted your parameters to check if all other values match, and they do.
Whats going on here?
My SSE always reaches 141.4415 (which is higher than the one with your final parameters).
I have tried using solver many many times to see if i would reach different values but it always comes down to the same result.
Can you please help me?
Thank you.
Daniel,
I just reran the example using Solver and again got values fairly similar to those calculated previously. In particular SSE is around 109.
I don’t know why you are getting different answers.
Charles