The forecasting approach is exactly as described in Real Statistics ARMA Data Analysis Tool. The only difference now is that we need to account for the differencing.
Example
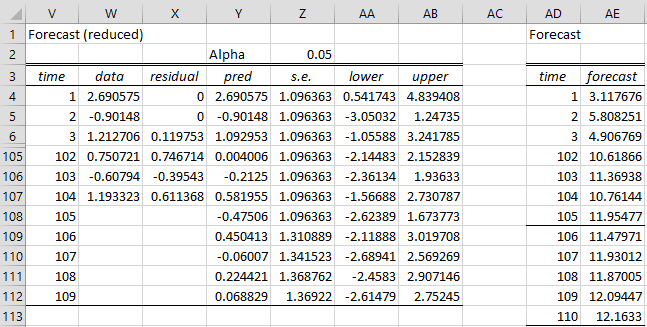
Example 1: Find the forecast for the next five terms in the time series from Example 1 of Real Statistics ARMA Data Analysis Tool based on the ARIMA(2,1,1) model without constant term.
Figure 1 – Forecast for ARIMA(2,1,1) model
The table on the left side is calculated exactly as in Figure 3 of Real Statistics ARMA Data Analysis Tool. The right side undoes the differencing. E.g. Cell AD4 contains the formula =B4 (with reference to the data in Figure 1 of Calculating ARIMA Model Coefficients). Cell AD109 contains the formula =X108+AD108.
Note that if you had not assumed that there was no constant term, cell AD109 would contain the formula =X108+AD108+J$6. If Differences is 2, then AD109 would contain the formula =X107+2*AD108-AD107+J$6.
Examples Workbook
Click here to download the Excel workbook with the examples described on this webpage.
References
Hamilton, J. D. (1994) Time series analysis. Princeton University Press
https://press.princeton.edu/books/hardcover/9780691042893/time-series-analysis
Wooldridge, J. M. (2009) Introductory econometrics, a modern approach. 5th Ed. South-Western, Cegage Learning
https://cbpbu.ac.in/userfiles/file/2020/STUDY_MAT/ECO/2.pdf
Wei, W. (2006) Time series analysis: univariate and multivariate methods, 2nd edition. Pearson Addison Wesley https://www.researchgate.net/publication/236651810_Time_Series_Analysis_Univariate_and_Multivariate_Methods_2nd_edition_2006

Dear Dr. Zaiontz,
If I wanted to run a SARIMAX model, would I do it just like how you did ARIMAX, except instead of using ARIMA, I would use SARIMA on the residuals of the linear regression analysis?
Best regards,
Crispus
Hello Crispus,
Sorry, but Real Statistics hasn’t yet addressed SARIMAX models. Perhaps the following is useful
https://www.youtube.com/watch?v=9BdcJisuOkU
Charles
thanks and regards, Devansh Chaurasiya
Hi Charles,
If i have removed the trend and seasonality in a model using quad + periodic dummies and used the resulting errors to build an ARIMA model which part of the model’s output should be considered to add back to the original errors? That is, forecast (reduced) table or forecast table.
Thanks,
Vijay
Vijay,
If you remove trend and seasonality to create the initial data set, then you would need to use the reduced forecast table.
Charles
Hi, Charles!
Most data I’ve been working with is non-stationary and has both trend and seasonal components. In this case, why (or when) should I use ARIMA models instead of Holt-Winter’s? It’s just a matter of accuracy comparision?
Thank you!
Leonardo,
You need to remove the trend and seasonality before the ARIMA model would be useful. I am in the process of adding SARIMA (seasonal ARIMA) and so this approach may be useful (as well as Holt-Winter).
Charles
Thanks, Charles!
Hi Charles,
Predicting stock price data for intraday 1 minute candle. Data is stationary when d = 1, used your ARIMA tool.
ADF Test
criteria schwert
drift yes
trend yes
lag 16
alpha 0.05
tau-stat -10.48182928
tau-crit -3.42474216
stationary yes
aic 2.604432535
bic 2.684661284
lags 4
As time increases by each 1 minute with new data, it is observed that
AR Order 2
MR Order 3,4,5,….20,22,
Diff 1
Question: What does it interpret when MR order increases more than 20, as your tool is restricted to 20. Do i need to change anything so that it works?
Thanks,
Venkat
Venkat,
Are you saying that you need an MA order larger than 20? The limit I am using is arbitrary, but it is hard-coded in the software. I can increase this limit in a future release. Let me know what limit makes sense to you.
Charles
Hi Charles,
Yes, it would be great if you can increase the limit further or some other way which we can get the same results with less MA order using some transformations.
Thanks,
Venkat
Venkat,
20 seems like a pretty high value, but I will look into increasing it slightly. You should make sure that you really need more than 20.
Charles
Hi Charles,
Yes, i need more than 20. Based on my experience with the data, i have observed that MA order has
greater than 30 as well. Is it possible to fix the limit as 50 so that it can be usefull. May be this be can be edited in the future release which was hard coded.
Thanks,
Venkat