Worksheet Functions
Real Statistics Functions: The following functions are provided in the Real Statistics Resource Pack to perform the Kolmogorov-Smirnov test both when the mean and standard deviation are specified and when they are estimated from the data.
KSSTAT(R1, avg, sd) = statistical value for the KS test on the data in R1
KSTEST(R1, avg, sd, txt) = p-value for the KS test on the data in R1
If sd is specified (i.e. is a positive value), then the mean and standard deviation specified by avg and sd are used in calculating the Dn value in KSSTAT (and p-value for the KS test). Also, in this case, the KSPROB function is used to calculate the p-value in KSTEST.
When sd is not specified, the mean and standard deviation are estimated from the data in R1 in the calculation of the Dn value in KSSTAT. Also, the LPROB (i.e. Lilliefors table) is used to calculate the p-value in KSTEST.
As noted above, KSPROB is calculated by KSPROB or LPROB, either of which uses the txt argument to determine whether to produce the value of 1 when p-value > .2 (if txt = FALSE, default) or “> .2” (if txt = TRUE). The situation is similar for low values of p-value, except that here the lowest p-value for KSPROB is .001 while the lowest value for LPROB is .01.
Raw data vs. frequency table
R1 must contain one or two columns. If R1 contains one column, then the raw data in R1 is used, while if R1 contains two columns then R1 is interpreted as a frequency table: the first column contains the values and the second column contains the corresponding frequencies. If the first frequency value is zero or blank then the midpoints between adjacent values are used to calculate the mean and standard deviation (assuming sd is not specified); otherwise, the mean and standard deviation are calculated directly from the pairs of values in R1.
In either case, the first column must be in ascending sorted order.
Observations
We can address Example 2 of Kolmogorov-Smirnov Normality Test using the KSSTAT and KSTEST, as shown in Figure 1. If the mean and standard deviation are estimated from the data, we get the results shown in cells D4 and D5.
If the mean and standard deviation are specified by the values in cells D7 and D8, we get the results shown in cells D9 and D10. Recall that when txt = FALSE (default) a p-value = 1 (cell D10) simply means that the p-value > .20 (the largest value in KS table of critical values).

Figure 1 – KS Test for raw data
Frequency Table
In Figure 2, we show how to perform the KS test when the data is in the form of a frequency table. In this case, we use the data from Figure 1 of Kolmogorov-Smirnov Normality Test except that we have modified the frequency for x = 400 (so that we get a significant result).
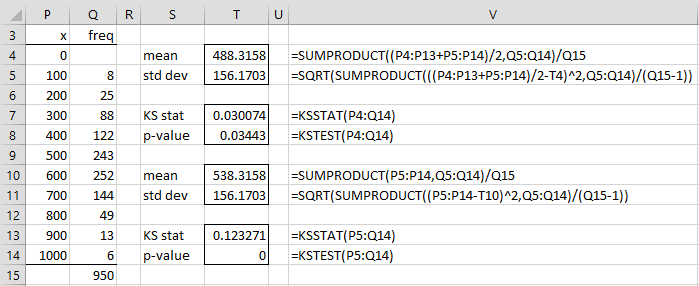 Figure 2 – KS Test for frequency table data
If we use the midpoint approach, then the Dn value is calculated in cell T7 with the corresponding p-value shown in cell T8. Note that we use the range P4:Q14, where cell Q4 is empty.
We can calculate the mean and standard deviation from the data as shown in cells T4 and T5. Thus, we get the same result for cell T7 by using the formula =KSSTAT(P4:Q14,T4,T5). The result in cell T8 can also be obtained using the formula =LPROB(T7,Q15).
If we don’t use the midpoint approach, then the Dn value and p-value can be calculated as shown in cells T13 and T14. Note that p-value = 0 (cell T14) simply means that p-value < .01 (the smallest value in the Lilliefors table of critical values).
We can calculate the mean and standard deviation from the data as shown in cells T10 and T11. Thus, we get the same result for cell T13 by using the formula =KSSTAT(P5:Q14,T10,T11). The result in cell T14 can also be obtained using the formula =LPROB(T13,Q15).
Data Analysis Tool
Real Statistics Data Analysis Tool: For input data in the form of a frequency table, the Frequency Table Descriptive Statistics data analysis tool can be used to test the data in the frequency table for normality using the KS test.
E.g. for the data in Figure 6 of Frequency Data Conversion, (repeated on the left side of Figure 3 below) if the Kolmogorov-Smirnov Test option in the dialog box shown in Figure 5 of that webpage is selected, then the test results shown in range Y3:Z6 of Figure 3 is returned indicating that the data is normally distributed.
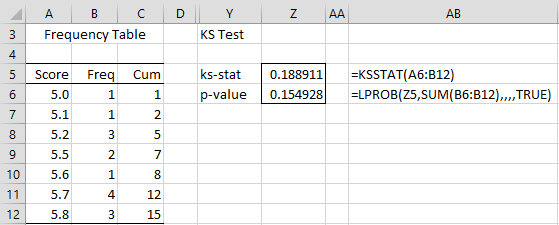
Figure 3 – Frequency Table data analysis tool KS output
Examples Workbook
Click here to download the Excel workbook with the examples described on this webpage.
Reference
Lilliefors, H. W. (1967) On the Kolmogorov-Smirnov Test for Normality with Mean and Variance Unknown, Journal of the American Statistical Association, Vol. 62, No. 318, pp. 399-402.
https://pdfs.semanticscholar.org/4aad/1756e88dba86399a75891895e00b160f5460.pdf
National Institute of Standards and Technology NIST (2021) Kolmogorov-Smirnov goodness-of-fit test
https://www.itl.nist.gov/div898/handbook/eda/section3/eda35g.htm
Wikipedia (2012) Kolmogorov-Smirnov test
https://en.wikipedia.org/wiki/Kolmogorov%E2%80%93Smirnov_test