Worksheet Function
Real Statistics Function: The Real Statistics Resource Pack provides the following array function to calculate the log-rank test and other tests to determine whether two survival curves are statistically different.
LOGRANK(R1, R2, lab) – returns a 4 × 2 range which contains the following statistics along with their p-value (using a chi-square test with df = 1): Log-rank 1, Log-rank 2, Wilcoxon, Tarone-Ware, when lab = FALSE (default). If lab = TRUE, then the output is a 5 × 3 range including labels.
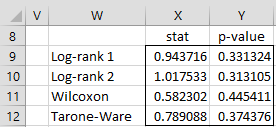
Referring to Example 3 of Log-Rank Test, the output from the array formula =LOGRANK(H8:I19,O8:P19,TRUE) is shown in Figure 1.
Figure 1 – Log-Rank and similar tests
Data Analysis Tool
Real Statistics Data Analysis Tool: The Real Statistics Resource Pack provides the Survival Analysis data analysis tool to perform Kaplan-Meier survival analysis.
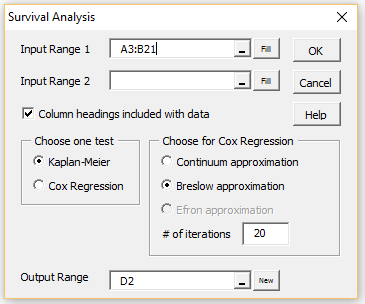
For example, to perform the analysis for Example 1, press Ctrl-m and select the Survival Analysis option (selected from the Misc tab when using the Multipage user interface). Fill in the dialog box that appears as shown in Figure 2 and click on the OK button.
Figure 2 – Survival Analysis dialog box
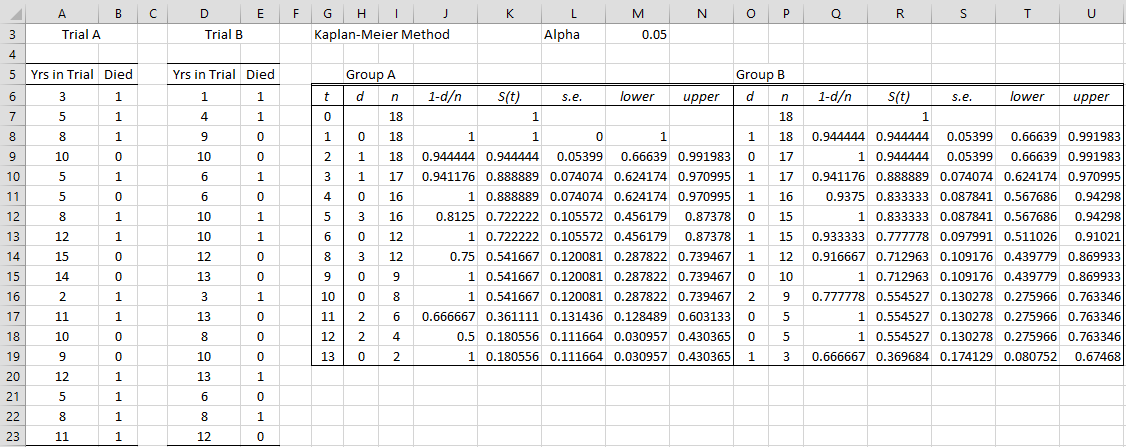
The output for the one-sample analysis is shown in Figure 3.
Figure 3 – Kaplan-Meier Survival Analysis
The analysis for Example 3 is done similarly. This time by inserting A5:B23 in Input Range 1 and D5:E23 in Input Range 2 of Figure 2. The output is shown in Figure 4 and 5.
Figure 4 – Kaplan-Meier Survival Analysis Part 1
Figure 5 – Kaplan-Meier Survival Analysis Part 2
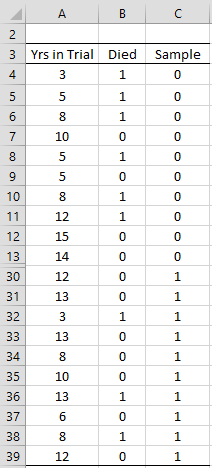
Note that you can also use a stacked version of the data in Figure 4 as input. Such data consists of three columns, where the third column contains a 1 for the elements in Trial A and a 2 for the elements in Trial B (actually any two numbers will do). Figure 6 shows the first 10 and last 10 data elements for Example 3 in this format. If you insert range A3:C39 in Input Range 1 (leaving Input Range 2 blank) of the dialog box in Figure 2, then the output will be the same as that shown in Figures 4 and 5.
Figure 6 – Data (middle 16 data elements not shown)
Examples Workbook
Click here to download the Excel workbook with the examples described on this webpage.
References
Wikipedia (2015) Kaplan-Meier estimator
https://en.wikipedia.org/wiki/Kaplan%E2%80%93Meier_estimator
Rich, J. T. et al. (2014) A practical guide to understanding Kaplan-Meier curves
https://www.ncbi.nlm.nih.gov/pmc/articles/PMC3932959/
MedCalc (2023) Kaplan-Meier survival analysis
https://www.medcalc.org/manual/kaplan-meier.php
NCSS (2015) Kaplan-Meier curves (logrank tests)
https://www.ncss.com/wp-content/themes/ncss/pdf/Procedures/NCSS/Kaplan-Meier_Curves-Logrank_Tests.pdf
Sullivan, L. (2016) Comparing survival curves
https://sphweb.bumc.bu.edu/otlt/MPH-Modules/BS/BS704_Survival/BS704_Survival5.html
Tian, L., Olshen, R (2017) Survival analysis: logrank test
https://web.stanford.edu/~lutian/coursepdf/survweek3.pdf


I was going through the example data in the Excel document you have provided. When I calculate the Kaplan-Meier Method using 4 columns, 2 columns for each Trial I the calculations for the upper and lower in the tables are different from what you have on the page, https://real-statistics.com/survival-analysis/kaplan-meier-procedure/real-statistics-kaplan-meier/ . If I put the entire data sets into 3 columns as shown in figure 6, the lower and upper confidence interval calculations are as you have shown in figure 4. Do you know why there is this difference?
Hi Dale,
There shouldn’t be any difference.
I have just added a link to the Excel spreadsheets used on this webpage. You should check to see whether there is a difference.
Charles
I downloaded the spreadsheet listed above and saw the lower and upper numbers on KM2 page. I copied the data sets to an new sheet and ran the Survival Analysis from the Misc tab of Real Statistics. For the Input Range 1 I used ‘Sheet1’!$A$5:$B$23 and Input Range 2 was ‘Sheet1’!$D$5:$E$23. Column heading included with data was checked. I used the Kaplan-Meier test and the Breslow approximation with 20 iterations. Output range was ‘Sheet1’!$G$3. The lower and upper numbers for t=13 were 0.142961 and 0.22173. I am using Microsoft 2016, Excel version 2412. The information from the XRealStatsX.xlam is that the date last saved was 1/15/2025 at 3:52 AM.
Hi Dale,
Can you email me the spreadsheet?
Charles
Dale,
Looks like only the confidence intervals are different. Probably a bug in the formula. I will check later.
Charles
Hi Charles.
Thank you for your amazing work here. I started looking into Kaplan Meier survival analysis, and in statistical software like STATA it is possible to add “Numbers at risk” to the diagrams. Have you considered that option, or did I miss it?
Hi Ulrich,
I don’t use STATA, so could you clarify what the “Numbers ay risk” are? In particular, are these the labels for the points in the chart in Figure 3?
Charles
Hi Charles.
Oh… I just realized that you answered. Sorry. I must have missed an email notification.
Anyways… the “numbers at risk” are the “n” in figure 3 above. They indicate how many n there is left (censored) in the trial at time t. These n can again be split in subgroups with performance status or certain blood tests etc.. I wish I could add a screenshot here, but you can see some examples here:
https://towardsdatascience.com/kaplan-meier-curves-c5768e349479
or here:
https://xena.ucsc.edu/kaplan-survival-analysis/
Best regards
Ulrich Koehler
Hi Ulrich,
Let’s look at the survival chart in Figures 1 and 2 of https://real-statistics.com/survival-analysis/kaplan-meier-procedure/survival-curve/
Here the chart is plotting S(t). If you want numbers at risk, this is a similar chart but with different labels. This is a plot of n vs t. You can obtain that chart as a step chart using the data in columns D and F from Figure 1. Suppose I copy these values into a new spreadsheet into range A1:B10. I can then use the Real Statistics Step Chart data analysis tool on A1:B10 as described at
https://real-statistics.com/real-statistics-environment/step-charts/
This will give you a chart of the numbers at risk. If necessary, you could right click on any of the points in the chart and then select the Add Data Labels option.
Charles
Dear Dr. Zaiontz.
Thank you for your PERFECT site according Kaplan-Meier.
A few days ago I asked you for help according repairable Systems. This Topic is solved. It just was a matter of sorting / filtering the Population accordingly.
Kind regards,
Dr. Detlef Maier
Thanks for updating me on this.
Charles
Hello Charles,
thank you for your awesome explanations. I have successfully applied the Kaplan-Meier procedure to render survival curves; however I would like to use your program to automate the process, instead of copying and pasting everytime.
The Kaplan-Meier options works great but stops at the last “dead” patient, and does not display further data even though I have some censored patients alive. How can I display those in the chart? Also, does their absence inficiate over p value?
Thanks!
Hi Filippo,
I am pleased that you like the explanations on the website. I try my best to make the explanations easy to understand yet rigorous enough.
The Kaplan-Meier process stops at the last dead patients since it is unknown when the remaining patients will die. If you have some way of knowing this or estimating this, then you can extend the table and chart with this information.
The alive patients are shown on the chart since the last point on the chart is not ay y = 0 but at y = the # of patients that are still alive.
To see whether the # of alive patients influence the p-value, I suggest that you rerun one of the analyses changing only the number of patients who are alive at the end (say from 2 to 1).
Charles
Hello Dr. Zaointz.
I have a question and the answer is probably very obvious as I haven’t found an explanation anywhere: what is the difference between log-rank 1 and 2?
Thank you so much for your help – your website has been incredibly useful and I’m very grateful.
Hello Manuela,
Log-rank test #1 is explained at Log-Rank Test
Log-rank test #2 is explained at Other Kaplan-Meier Comparison Tests
Charles
Ah, so log-rank test 2 is the “alternative” version! Thank you!
Manuela,
Yes. Sorry that I hadn’t made this clearer. I will look into making this clearer shortly.
Charles
Dr. Zaiontz good morning. Dr. How can I compare, more than two variables in the survival curve of Kaplan Meier, using Real Statistics?
Dr. Zaiontz buenos días. Dr. Como puedo comparar, más de dos variables en la curva de supervivencia de Kaplan Meier, usando Real Statistics?
Hello Gerardo,
I have not yet researched this issue. At this point, I can suggest that you perform multiple pairwise comparisons using an alpha correction such as Bonferroni’s correction.
Charles
Hi Charles,
I get the same error as Soraya, when I tried Survival analysis in Excel 2013.
“Compile error in hidden module: Survival. This error mainly occurs when code is incompatible with the version, platform, or architecture of this application”
I checked and the ‘Solver’ Add-in is not checked.
Can you please check that?
This type of error is consistent with Solver not being checked. I suggest that you check Solver.
Charles
Hello Charles,
I’m looking at your tutorial on how to generate Kaplan Meir step curves. I cannot for the life of me figure out how you generated your ‘n’ column data (column F) https://real-statistics.com/survival-analysis/kaplan-meier-procedure/survival-curve/ or on this page https://real-statistics.com/survival-analysis/kaplan-meier-procedure/real-statistics-kaplan-meier/
It seems like the final percentage mortality doesn’t match up with what would be expected. What is the equation you used to generate the ‘n’ columns used in the 1-d/n?
Thanks for your help.
Todd,
This is explained on the following webpage:
https://real-statistics.com/survival-analysis/kaplan-meier-procedure/kaplan-meier-overview/
Charles
Thanks for a great plug in, hugely helpful.
Is there a means to plot more than 2 KM curves and to test for differences between each?
Andy,
Currently, only the standard two curves are supported.
Charles
Charles,
great website…
I am looking at oil well failure (due to integrity problems) data with my dataset including either –
1. Failed wells (these wells may have been drilled at start-up or drilled later)
2.a. No-Failure Wells
– drilled pre-startup and still haven’t failed = right censored
– entered service late (due to either infill drilling and/or wellbore repair) but haven’t failed = right censored
2.b. No-Failure Wells
as per 2.a. but well life curtailed due to sidetracking the well for production reasons (rather than integrity failure) = right censored
I can use Kaplan-Meier (after following your example), but I wanted to compare to Weibull. This is straight forward for non censored data using Excel’s regression (data analysis pack) for y = ln(ln(1/(1-Median Rank))) and x = ln(well life). Beta Shape factor = slope & Alpha Scale factor = exp*(-Intercept/Beta Shape factor).
My question is whether you have an excel based method to determine Beta and Alpha from a dataset that includes right censored data? as per my example.
Regards,
Andrew
Andrew,
I don’t provide an Excel method with censored data. In the latest release of the software (Rel 5.0, released today), I do provide a capability for automatically estimating the Weibull parameters using regression, method of moments and maximum likelihood.
Charles
Hi
I’m trying to perform a Kaplan-Meier test on data using 2016 32 bit excel for windows. Whenever I try to complete it, it comes up with the following message: “Compile error in hidden module: Survival. This error mainly occurs when code is incompatible with the version, platform, or architecture of this application” I have downloaded the correct version for 2013/2016 and followed all instructions for installation so not sure what is going wrong here
Soraya,
Are you using the latest version Real Statistics (Rel 4.14)? When you press Alt-TI do you see both RealStats and Solver on the list of addins with check marks next to them?
If so, one suggestion is to try to use the Excel 2007 version of the Real Statistics software to see whether this works better for your computer. By the way, what language of Excel are you using (English, French, etc.)?
If non of this helps, if you send me an Excel file with your data, I will try to figure out if there is a problem in the Real Statistics software.
Charles
Hi,
I’m environnemental engineer and i’m a master student in Civil engineer
at the Sherbrooke University. In this moment i’m writing a scientific
article about biological treatments and i have a data base with 40
sampling dates (more or less) and my datas show me a lot (30 to 50% of
data) of Non detected values at the effluent of my bioreactors.
In this moment i have a problem because i need to compare influent vs
effluent and obtain representative mean, médian and ecart-type.
What it’s the best method to obtain this values?
Hoe can I used the Kaplan-Meier to censored data?
Thank’s
Sebastian.
Juan,
I would need a lot more information to be able to tell you which is the best test to use. Kaplan-Meier is generally used with censored data. The following webpage explains how to use this test: Kaplan-Meier.
Charles