We show how to use the Log-Rank Test (aka the Peto-Mantel-Haenszel Test) to determine whether two survival curves are statistically significantly different.
Example
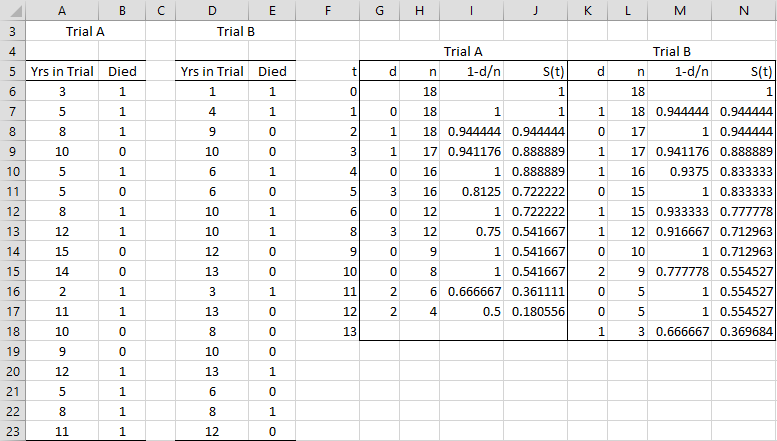
Example 1: Clinical trials of two cancer drugs were undertaken based on the data shown on the left side of Figure 1 (Trial A is the one described in Example 1 of Kaplan-Meier Overview).
As we did in Example 1 of Kaplan-Meier Overview, we can use the Kaplan-Meier method to calculate the empirical survival functions for each trial (using the combined values for the times t). This is shown in Figure 1.
Figure 1 – Two sample case
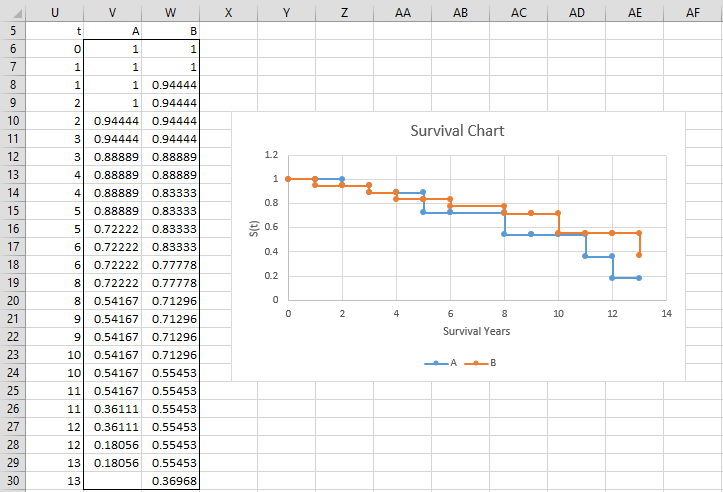
We now create survival charts for both trials, as shown in Figure 2.
Figure 2 – Survival curves for both trials
Hypothesis Test
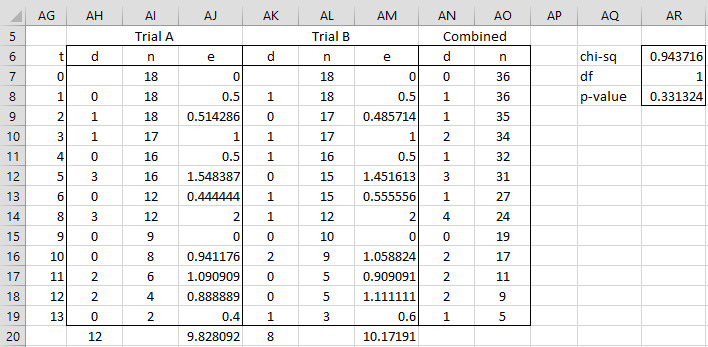
The results of the trials look similar, but are they statistically equivalent? We use the log-rank test to determine this. First, we create the following worksheet, based on the data in Figure 1, as shown in Figure 3.
The test resembles the chi-square test of independence. The observed values for the number of deaths are those given in columns AH and AK. We calculate expected values for the number of deaths for each time t for each trial (columns AJ and AM). The expected values and
for time tj for trials A and B are given by the formulas
Figure 3 – Log-Rank Test
The log-rank test statistic is then
If the null hypothesis is true (that the two survival distributions are the same), then the log-rank test statistic has a chi-square distribution with one degree of freedom, i.e.
For Example 2, ObsA = SUM(AH7:AH19) = 12 and ExpA = SUM(AJ7:AJ19) = 9.828, and similarly for trial B. Thus the log-rank test statistic (cell AR6) is
We see from Figure 3 (cell AR8) that p-value = CHISQ.DIST(AR6,AR7,TRUE) = .331 > .05 = α, and so we cannot reject the null hypothesis that the survival rates for the two drugs under trial are statistically the same.
Examples Workbook
Click here to download the Excel workbook with the examples described on this webpage.
References
NCSS (2015) Kaplan-Meier curves (logrank tests)
https://www.ncss.com/wp-content/themes/ncss/pdf/Procedures/NCSS/Kaplan-Meier_Curves-Logrank_Tests.pdf
Sullivan, L. (2016) Comparing survival curves
https://sphweb.bumc.bu.edu/otlt/MPH-Modules/BS/BS704_Survival/BS704_Survival5.html
Tian, L., Olshen, R (2017) Survival analysis: logrank test
https://web.stanford.edu/~lutian/coursepdf/survweek3.pdf


I am looking at a paper that only has the mean survival for two conditions. There were no statistical analysis for this in the paper. Is there a way to determine whether there is a difference between the two groups? Survival for group 1 is 420 days and 300 days for the other group.
Hi Dale,
Clearly 420 days is better than 300 days if survival represents a positive property, but you don-t have enough information to say whether this is a characteristic of the whole population.
Charles
where can I find the excel template that is downloadable for this example?
Hi Jane,
I have just added a link to the Excel spreadsheet towards the end of this webpage.
Charles
Dr Zaiontz,
Can I run the Log-Rank Test is my ‘years in trial’ are the same for every row and for both samples. I want to test for a difference in survivorship between two populations, both were studied for 19 years.
Thanks,
Gerard
Hello Gerard,
I woud think that this should work, although I have never tried it when the “years in trial” were the same. I suggest that you try and see what happens. It should work.
Charles
why the time point of 9 years is added to the tables in Figures 1 and 3 as there are no death events in both groups for this time point?
Hi Kathrin,
Because there is a data point for t = 9 in the input data.
Charles
thank you Charles for a quick response. Can we omit the data points for which there are no events in either group (like t=9)? in the example above, t=9 doesn’t contribute to the expected and the observed values (the sums). Is there a case when they do contribute and therefore must be included in the calculations?
Hi Kathrin,
Sorry, but I don’t know the answer to your question. Once you work through the math it is probably obvious what the answer is, but I haven’t had the time to do this. Perhaps you can change your data in a few ways to test out some possible cases.
Charles
Dr Zaiontz,
Hello and thank you for all your amazing and comprehensive tutorials. Using your data, I replicated the whole p value calculation step. I had successfully replicated all the values as shown in your tutorial. However, when I reached the final step of calculating p values, instead of 0.331324, I obtained 0.668676 (which is actually 1-0.331324). I checked my formula and didn’t see anything wrong. Would you happen to know what happened?
Looking forward for your reply soon.
Adam
Hello Adam,
I am pleased that you are getting value from the tutorials.
I used the CHISQ.DIST.RT (or CHIDIST) function (right tail) to calculate the p-value. You probably used the CHISQ.DIST function (left tail). You need to use the right tail version of the Chi-square distribution to get the p-value.
Charles
Dr Zaiontz,
Thank you for quick reply. And yes! I did made a mistake with the formula and it now works! Thank you so much!
Adam
Hi,
Thank you very much! I want to do a log rank test in excel but how do I include censored patients?
Hello Charlotte,
This webpage explains how to perform a log rank test with censored data.
Charles
Hello, thank you for your brief yet clear explanations. Just a note: there is a missing question mark in the first sentence after Figure 2: The results of the trials look similar, but are they statistically equivalent.
Hello Jiří,
Thanks for identifying the missing question mark. I have now added this.
The chi-square test in Figure 3 shows that there isn-t evidence to disprove that they are equivalent.
Charles
Hi Charles,
I found your article very useful, and helpful to begin to understand the principles of survival analysis and the Log-rank test. I do have a concern, though, which is that taking your raw data and running it through survival analysis in both GraphPad Prism and R with the survival package gives a different result. In both cases the chi-square test result is 1.017, with a p=0.313. Sure, the difference is very small, but nevertheless since both other methods agree with each other I fear that there is a problem somewhere with your methodology.
Best wishes,
David
Hi David,
I get the same result as GraphPad Prism and R when you use the alternative log-rank test as described at
https://real-statistics.com/survival-analysis/kaplan-meier-procedure/kaplan-meier-comparison-tests/
Charles
Prof,
I think there’s a typo here: ExpA = SUM(AJ7:AJ19) = 9.428
“9.428” should be “9.828092” (as shown on Figure 3), and subsequently, using the correct value to calculate the LR yields 1.069618. Using =CHIDIST() yields 0.301032. It still doesn’t change the fact the we reject the null. Just a bit confusing when following along.
Many thanks for the lecture!
-Ray
Ray,
I believe that the calculations shown in Figure 3 are correct, although, as you correctly point out, there is a typo in the text (9.428 should be 9.828). The values for LR and p-value still seem to be correct.
Let me know whether you disagree and thanks for identifying the error in the text.
Charles
Hello,
All the explanation is really clear, thank you!
But I cannot understand how you calculated the value “df=1” in cells AQ7 in figure 3.
Can you explain me?
Thank you very much,
Federica
Federica,
The test always uses df = 1 (as described towards the end of the webpage).
Charles
is it possible for uncensored cases? as i did for my KM curve, the input same. but the chi square value i got is 2k.
Kov,
What formula did you you use to get a chi-square value of 2k? Do you mean 2,000?
Charles
I am looking for step by step (simple) instruction on how to use excel for log rank. Is it something like that on these pages (or elsewhere)?
Thank you!
Raphael,
This webpage shows how to calculate log rank using Excel.
Charles
Hi Charles,
Is it possible to offer a three sample case using log-rank test? Thanks.
Bing
Bing,
Perhaps the following article will be helpful:
ssp.unl.edu/Log%20Rank%20Test%20For%20More%20Than%202%20Groups.pdf
Charles
Thank you, Charles.
Bing
Dear Dr Zaiontz,
First, thank you very much, this website as been very useful.
I was wondering why we keep the censored data when calculating Log-Rank Test.
Also, if in your example, all patients in trial B were dead after 10 days, I assume you would still calculate “e” for trial A and B up to day 13. Am I right ?
Thank you for your time
Marc,
Doesn’t Figure 3 of the referenced webpage provide the answer to your question?
Charles
how would you calculate e if study is complete in that all the patients have passed? since you are dividing the n of one set to the total n, you end up dividing by 0. is the last e value set as 0?
Kwan,
Perhaps I don’t understand your question, but n is never set to zero. When the study is complete n is not zero, If you take it one step later (i.e. past completion) then yes n would be equal to zero, but you should not include that step in the analysis.
Charles
How did you calculate column AN?
Bess,
Each cell in column AN is the sum of the corresponding values in the AH and AK columns.
Charles
I think you should use a right-tailed chi-squared distribution for calculating the p-value:
p-value = CHISQ.DIST.RT(AR6,AR7)
otherwise the bigger the log-rank, the closer to 1 the p-value gets, instead of being smaller.
Ran,
I believe that I used the older CHIDIST function, namely =CHIDIST(AR6,AR7) which is equivalent to = CHISQ.DIST.RT(AR6,AR7)
Charles
Yes, I was unable to reproduce your methods until I used CHISQ.DIST.RT(AR6,AR7). Thank you this has been very helpful.
In figure 3, how did you calculate e?
Cullom,
You use the formula written above Figure 3. For example, the value in cell AJ9 is calculated via the formula =AI9/AO9*AN9.
Charles
Does the AO9*AN9 need to be in parentheses?
James,
I don’t see any reference to AO9*AN9 on the referenced webpage. Where are you looking?
Charles
I was referring to your previous comment: “Cullom,
You use the formula written above Figure 3. For example, the value in cell AJ9 is calculated via the formula =AI9/AO9*AN9.
Charles”