Worksheet Functions
Real Statistics Functions: The Real Statistics Resource Pack provides the following array functions:
COXEST(R1, approx, iter) – n × n+5 array as described in Figure 1 based on the data in the m × n+2 range R1 formatted as in range B4:E21 of Figure 3 of Cox Regression using Solver. The approx parameter takes the value: 0 if the continuum approximation is used, 1 if the Breslow approximation is used, or 2 if the Efron approximation is used, default is 1; the Efron approximation is not currently supported. The output is calculated using Newton’s Method with iter iterations (default = 20).

Figure 1 – COXEST output
Note that the continuum approximation is the one used when dj = 1 for all time periods. When there are multiple deaths in some time periods, then the assumption is that the time periods are slightly different (in some semi-random order). The Breslow and Efron approximations are described in Cox Regression with Ties.
Prediction Function
COXPRED(R1, R2, R0, lab, approx, iter, alpha) – predicts the hazard ratio between the two subject profiles in the n × 1 column or 1 × n row ranges R1 and R2 based on a Cox regression model derived from the input data in the m × n+2 range R0. The arguments approx and iter are as for COXEST. The alpha argument is the significance value (default .05). If lab = FALSE (default), the output is a 4 × 1 range containing the hazard ratio, the standard error and the lower and upper limits of the 1 – alpha confidence interval. If lab = TRUE then the output is a 4 × 2 range whose first column contains row labels.
We can use the array formula
COXPRED(AK21:AK22,AL21:AL22,B4:E21,TRUE)
in range AN21:AQ22 (where B4:E21 is the model’s input data as shown in Figure 1 of Cox Regression using Solver) to address Example 3 of Cox Regression using Newton’s Method, as shown in Figure 2.
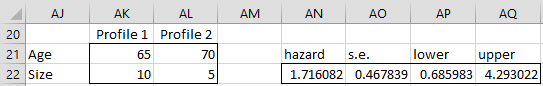
Figure 2 – COXPRED output
Data Analysis Tool
Real Statistics Data Analysis Tool: The Real Statistics Resource Pack provides the Cox Regression option to the Survival Analysis data analysis tool which implements Cox regression.
Example 1: Perform Cox regression for the study of the 40 patients shown in range A3:F43 of Figure 11 (the second 20 patients are repeated in range H4:M23 of Figure 3 so that they would fit on the page more easily). Each patient is being treated for liver cancer and the number of months of survival is recorded until the patient dies (d = 1) or leaves the study or has not died when the study ends (d = 0), along with the patient’s age, sex (0 = male, 1 = female), the value of a new blood test and the size of the tumor at the start of treatment.
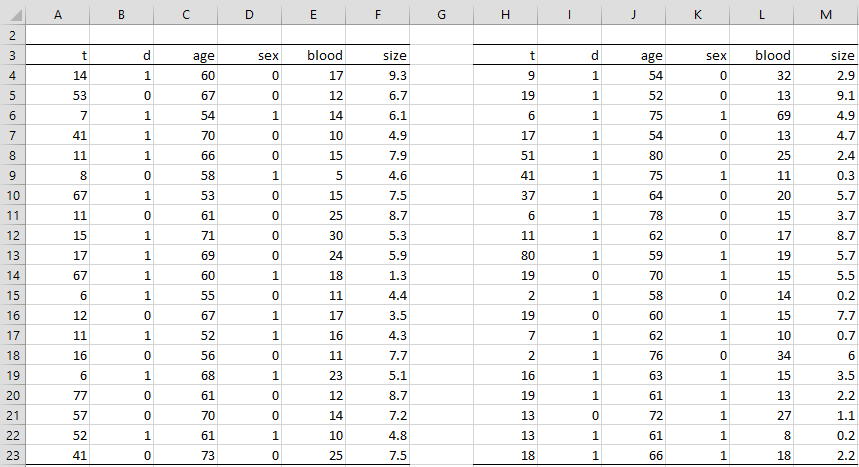
Figure 3 – Liver Cancer Study Data
To use the Real Statistics Cox Regression data analysis capability for Example 1, press Ctrl-m and select the Survival Analysis option (from the Misc tab if using the Multipage user interface). Next, fill in the dialog box that appears as shown in Figure 3, and click on the OK button.
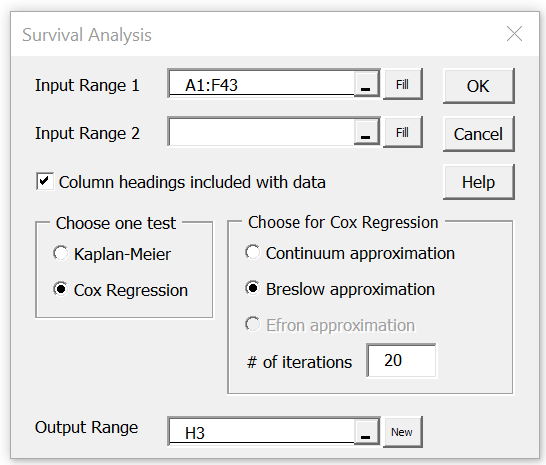
Figure 4 – Survival Analysis dialog box
Output
The output is shown in Figure 5.
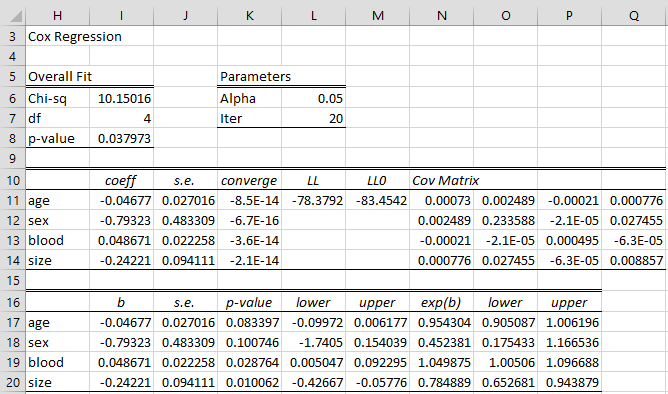
Figure 5 – Cox Regression data analysis tool output
Note too that the array formula =COXEST(A4:F43,1,20) produces the output shown in range I11:Q14 of Figure 5.
Log-Rank Test Example
Example 2: Repeat Example 3 of Log-Rank Test using Cox Regression.
The data for this example is shown in Figure 6 of Real Statistics Support for Kaplan-Meier (the first 12 elements of which are repeated in Figure 6 below). Using Real Statistics’ Cox Regression data analysis capability (filling the Input Range 1 field of Figure 3 with A3:C39) we obtain the output shown in Figure 6.
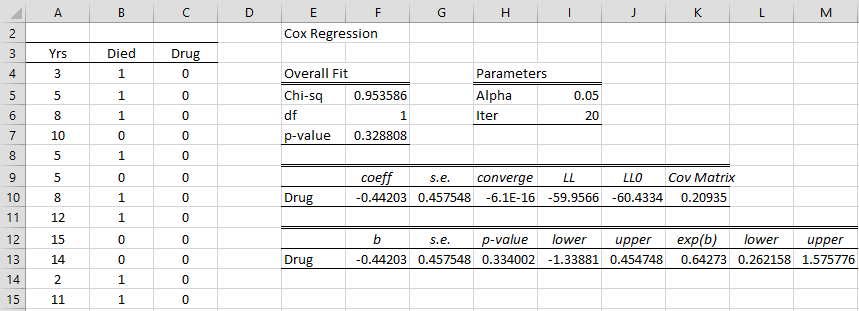
Figure 6 – Cox Regression comparing two drugs
Since the hazard ratio = exp(b1) = .64273 (cell K13), we see that an increase of 1 in the Drug covariate results in a reduction of 35.7% in the risk of death. But such an increase is simply a comparison of Drug A (covariate = 0) with Drug B (covariate = 1). Thus Drug B reduces the risk of death by 35.7% over Drug A (although, as we see from Figure 6, the 95% confidence interval is quite wide).
Examples Workbook
Click here to download the Excel workbook with the examples described on this webpage.
References
NCSS (2015) Cox regression
https://www.ncss.com/wp-content/themes/ncss/pdf/Procedures/NCSS/Cox_Regression.pdf
Collett, D. (2003) Modelling survival data in medical research. 2nd ed. Chapman & Hall/CRC
Zhang, D. (2011) Modeling survival data with Cox regression models
https://www.scribd.com/document/396594178
Wikipedia (2015) Proportional hazards model
https://en.wikipedia.org/wiki/Proportional_hazards_model
Grund, B., Yang, L. (2015) Hazard regression
https://edoc.hu-berlin.de/server/api/core/bitstreams/595cb9b6-0c1a-4121-8a83-8a194f19b3ae/content
Dear professor, why the Efron approximation is not currently supported?
Roberto Mioni
Hi Roberto,
I ran out of time to implement it. Since then, I have always found something more important to implement. I will eventually add this capability. In the meantime, I have explained how to implement Efron’s approximation on the website. Shortly, I will answer your questions clarifying this.
Charles
Thank you very much, professor.
Thank you for your helpful work..
Actually I work on estimating marginal PD curve for a portfolio of retail loans, and I wonder if we can estimate the baseline hazard rate (not hazard ratio) and PD curve using Real statistics capabilities for cox regression!
Hello Assaf,
Are you referring to the baseline hazard function described at the following webpage?
https://www.real-statistics.com/survival-analysis/cox-regression/cox-regression-basic-concepts/
Charles
Exactly.. and as described at the following webpage: https://www.real-statistics.com/survival-analysis/cox-regression/baseline-hazard-function/
Hi Assaf,
I have been asked about this several times recently.
I plan to address this issue shortly (i.e. once I have finished updating the website and examples workbooks for compatibility with Rel 8.0).
Charles
Many thanks .. I really appreciate your efforts..
what if the independent variable is categorical with 3 or more categories. Say Education (HS, Some College, College and Post Graduate) how am i treat the data.
Hi Jerome,
As usual, when performing regression with categorical data, you need to use dummy coding. E.g. with 4 categories HS, Some College, College and Post Graduate, you replace this categorical variable by three (one less than 4) dummy variables: T1, T2, T3
T1 = 1 for the HS category and T1 = 0 otherwise
T2 = 1 for the Some College category and T2 = 0 otherwise
T3 = 1 for the College category and T3 = 0 otherwise
Thus, for the HS category, T1 = 1, T2 = 0, T3 = 0
For the Post Graduate category, T1 = T2 = T3 = 0.
Charles
Dear Charles,
Since the hazard ratio = exp(b1) = 0,784889 (cell N20, Figure 5 on this page), does it mean that increase in the liver cancer size brings about ~20% reduction in the risk of death?
Regards,
Anatoly
Anatoly,
See http://162.129.44.20/courses/StatisticalReasoning2/PDFs/2009/StatR2_lec10a_mcgready.pdf
for how to interpret the coefficients.
Charles
Thank you for all your work, it’s been really helpful.
I’m trying to perform Cox Regression on approx 2,000 rows of data however when using the Real Statistics Cox Regression tool I receive errors when the input range is over about 200 rows. Can I still use the tool or do I need to do the solver method?
It should still work with 2,000 rows. If you send me an Excel file with your data and the output, I will try to figure out what is going wromg.
Charles