Basic Concepts
To compare two hierarchical models, we use the usual chi-square test on 2(LL1−LL0) where LL1 is the full (i.e. larger) model and LL0 is the reduced model (i.e. the model with k variables omitted).
2(LL1 – LL0) ~ χ2(k)
We can use this as a measure of overall model fit where LL1 is for the Cox regression model under consideration with k covariates and LL0 is the reduced model where all the coefficients are 0.
Example
For Example 1 of Cox Regression using Solver, we see from Figure 1 of Cox Regression using Solver that LL0 = -15.273 and from Figure 3 of Cox Regression using Solver we see that LL1 = -11.045. Based on the chi-square test shown in Figure 1 below, we see that there is a significant difference between the complete Cox regression model (i.e. the model with Age and Size covariates) and the baseline model (i.e. the model without any covariates).

Figure 1 – Chi-square Goodness of Fit
Age-only and Size-only
If we rerun the analysis we have done using only the Age covariate we find that the chi-square test shows that the model with only the Age covariate is statistically equivalent to the baseline model (p-value = .08) based on an alpha of .05. See Figure 2.
The model with only the Size covariate does a little better (p-value = .06), but it too is statistically equivalent to the baseline model based on an alpha of .05. Both covariates together give a better fit.
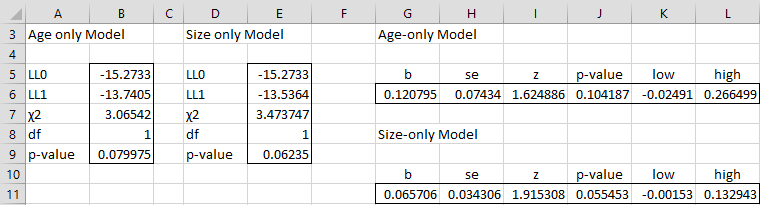
Figure 2 – Reduced models
Also, you should be aware that the chi-square test using the LL values is a better indicator than the p-values of the coefficients.
R-square
There is no commonly accepted value for R2 for Cox regression. The best available such value is
![]()
Examples Workbook
Click here to download the Excel workbook with the examples described on this webpage.
References
NCSS (2015) Cox regression
https://www.ncss.com/wp-content/themes/ncss/pdf/Procedures/NCSS/Cox_Regression.pdf
Collett, D. (2003) Modelling survival data in medical research. 2nd ed. Chapman & Hall/CRC
Zhang, D. (2011) Modeling survival data with Cox regression models
https://www.scribd.com/document/396594178
Grund, B., Yang, L. (2015) Hazard regression
https://edoc.hu-berlin.de/server/api/core/bitstreams/595cb9b6-0c1a-4121-8a83-8a194f19b3ae/content
Hello Charles thank you for the guidance but i wanna ask if their is any kind of tool you will recommend that will help doing survival analysis.
thank you!
Hello Megdi,
Real Statistics software provides survival analysis tools (on the Misc tab).
Charles
how to Fit the Cox Proportional Hazards model to excel data which i imported
Once you import your data you can use the approach described at
https://real-statistics.com/survival-analysis/cox-regression/real-statistics-capabilities-for-cox-regression/
You may need to first reformat your data into the format required by the Real Statistics functions and data analysis tool.
Charles
Hi Charles, thank you for this wonderful guide. Can you tell me what ranges you used for the Chi Square test for Goodness of Fit, i.e. 8.457131? I tried referencing the other webpages on Chi Square but I couldn’t make the connection to this set of data.
Dan,
I am glad that you liked the website.
Note that -2(LL1-LL0) = -2(-11.0447+15.273) = 8.457131
Now using Excel’s CHISQ.DIST function, we see that CHISQ.DIST(8.457131,2,TRUE) = .014573. Since this value is less than .05, we have a significant result. Note that since CHISQ.INV(.05,2) = .102587, any chi-square value less .102587 would give a significant result.
Charles
Hi Charles, isn’t -2(LL1-LL0) equal to a negative 8.457131? Because (-11.0447+15.273)= 4.2283 , thus multiplying this by -2 equals -8.4566?
Melanie,
The answer needs to come out positive and so the formula should be 2(LL1-LL0). Thanks for identifying this mistake. I have just changed the webpage to reflect the correction. I appreciate your help in improving the website.
Charles