Assumption Guidelines
The two independent sample t-test described above is valid provided the two samples are randomly taken from two populations that are normally distributed with the same variance.
The t-test is quite robust even when the underlying distributions are not normal provided the sample sizes are sufficiently large (usually over 25 or 30 so that the Central Limit Theorem applies). Even for smaller sample sizes, the test is usually valid provided the samples have similar sizes and shapes and are not too skewed.
The test is more robust to violations of normality the larger the sample size, the larger the alpha value, and the more equal the sample sizes are. The test is also quite robust to violations of normality provided the variances are equal.
Even when the variances are unequal, the t-test can be valid, especially when the sample sizes are equal. Also, the larger the ratio between the variances the larger the samples need to be. The test is more robust to a difference between variances when the larger sample has the larger variance.
Equal Sample Sizes
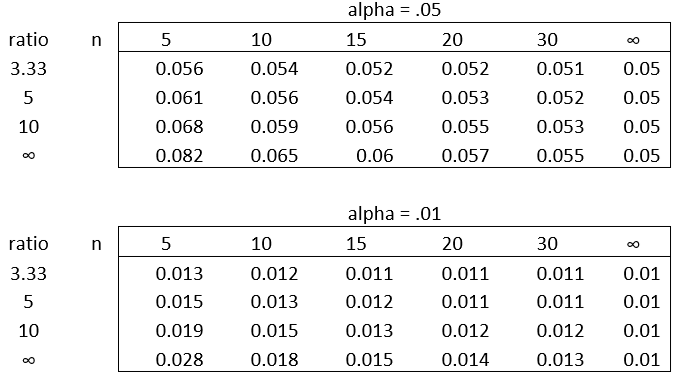
When the sample sizes are equal, the table in Figure 1 shows the real type I error based on the stated two-tailed alpha value, the ratio between the variances, and the sample size n.
Figure 1 – Type I error for equal sample sizes
Unequal Sample Sizes
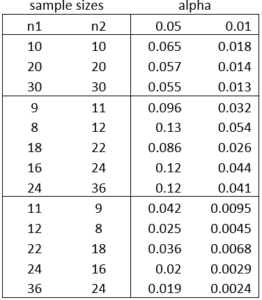
When the sample sizes are different, the discrepancy between the real type I error and the (two-tailed) alpha value increases as shown in the table in Figure 1, where sample 1 contains n1 elements, sample 2 contains n2 elements, and the ratio of the variance for sample 1 divided by the variance for sample 1 approaches infinity.
Figure 2 – Type I error for unequal sample sizes
As you can see from Figure 2, for samples of unequal size the discrepancy between the alpha value and real type I error is much larger than for samples of equal size. Also, the discrepancy is much less when the larger sample has a larger variance.
Dealing with Larger Error
When the samples are normally distributed, or at least not too far from normally distributed, and the variances are unequal, the two-sample t-test with unequal variances should be used. This is especially true when the sample sizes are different.
When the samples are not normally distributed, but the samples have similar shapes and variances, then the Mann-Whitney Test should be used. When the samples are not normally distributed and the samples have different shapes or variances, then you should consider using a transformation. Alternatively, you could use the Brunner-Munzel Test.
See also When t-test Assumptions are Violated.
Final Observation about Normality
A two independent sample t-test with equal variances is essentially a one-way ANOVA test in disguise, and so instead of testing each sample for normality, it is correct to test the combination of the data in the two samples each with their group means subtracted, as described in Normality Testing of ANOVA Residuals.
Reference
Zar. J. H. (2010) Biostatistical analysis 5th Ed. Pearson
jmp (2022) Two-sample t-test
https://www.jmp.com/en/statistics-knowledge-portal/t-test/two-sample-t-test


Dear Professor,
many thanks for this wonderful Excel tool!! I use this with students at University and it is very clear.
When dealing with two-sample T-test, the homogeneity of variance should be verified. Is there a specific option in Real-Stat to check this assumption? The two-sample F-test for variance homogeneity should be appropriated, but I cannot find this in Real-Stat.
Thank you in advance for your help!
SR
Simone,
1. You don’t really need to check the homogeneity of variance assumption for the t-test. There are two versions of this test, one when this assumption is met and the other when this assumption is not met. The Real Statistics data analysis tool reports both results. In general, if the variance of one sample is less than 3-4 times the other then the equal variance version of the test is probably pretty good (and will be similar to the unequal variance version of the test). This is less true when the sample sizes are quite different.
2. Excel provides support for the F-test via the F.TEST function and the F-Test Two-Sample for Variances data analysis tool, and so I felt that there was no need for a Real Statistics version of the test. See the following webpage for details:
https://www.real-statistics.com/chi-square-and-f-distributions/two-sample-hypothesis-testing-comparing-variances/
Note that you can also use Levene’s test. See
https://www.real-statistics.com/one-way-analysis-of-variance-anova/homogeneity-variances/
Charles
Dear Prof. Charles,
Many thanks for your clear and complete answer!
Simone
PS: Just one remark: it is a pity that when you answer to such comments there are no notifications via email to the original writer. It would be useful to be informed when your comments are added!
Hello Simone,
This is a good idea. I will look into a way of adding this capability.
Charles