Basic Concepts
When both the normality and equal variances assumptions are violated, we can use a combination of the Trimmed Means t-Test and Welch’s t-Test, called the Yuen-Welch Test. Using the notation for the Trimmed Means t-test, the Yuen-Welch Test is
Example
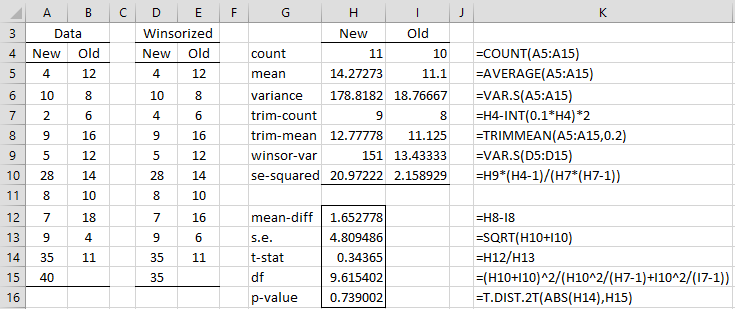
Example 1: Repeat Example 1 of Trimmed Means t-Test for the data in columns A and B of Figure 1.
Note that the data for the New flavoring is the same as in Figure 1 of Trimmed Means t-Test, and so once again the normality assumption is violated. From cells H6 and I6 of Figure 1, we see that the variances of the two samples are very different, and so we use the Yuen-Welch Test, as shown in Figure 1.
Figure 1 – Yuen-Welch test
Since the p-value = .74 (cell H16), we conclude that there isn’t a significant difference between the two flavorings. If we had used the usual Welch’s t-test we would have gotten a p-value = .75, which in this case is not much of a difference.
Worksheet Function
Real Statistics Function: The Real Statistics Resource Pack also provides the following function.
YUENTEST(R1, R2, lab, p, tails): outputs a column range with the values: p-value for the Yuen-Welch test on the data in R1 and R2 based on the trim percentage p (default 0.2). If lab = TRUE a column of labels is appended to the output (default FALSE). tails = 1 or 2 (default 2).
For Example 1, the output from the worksheet array formula =YUENTEST(A5:A15,B5:B15,TRUE) is as displayed in range G14:H16 of Figure 1.
Data Analysis Tool
Click here for information about a Real Statistics data analysis tool that supports the Yuen-Welch’s Test.
Examples Workbook
Click here to download the Excel workbook with the examples described on this webpage.
Reference
Steiger, J. H. (2009) Robust t Tests
https://www.statpower.net/Content/311/Lecture%20Notes/RobustT.pdf


Thank you so much for the info! I wonder is there any r package that can perform Yuen-Welch’s Test?
Iana,
I don-t use R, and so I don-t know whether Yuen-Welch’s test is supported. Probably yes, since R is very robust.
Charles
Yes, there are implementations in R. If we use Google: https://www.google.com/search?q=R+yuen+test
we obtain at least: PairedData, DescTools, WRS2
The test is typically called Yuen, but if you look at the implementation code, you will notice the Welch (-Satterthwaite) adjustment for degrees of freedom (actually this test was invented with this case in mind).
PairedData: df <- (d1 + d2)^2/(d1^2/(h1 – 1) + d2^2/(h2 – 1))
WRS2: df <- (q1 + q2)^2/((q1^2/(h1 – 1)) + (q2^2/(h2 – 1)))
DescTools: dfx <- length(x) – 2 * floor(trim * length(x)) – 1
dfy <- length(y) – 2 * floor(trim * length(y)) – 1
stderrx <- (length(x) – 1) * vx/((dfx + 1) * dfx)
stderry <- (length(y) – 1) * vy/((dfy + 1) * dfy)
df <- (stderrx + stderry)^2/(stderrx^2/dfx + stderry^2/dfy)
Hello Adrian,
I will add the Brunner-Munzel test in the next release of the Real Statistics software.
The new release will be available this month.
Thanks for your input.
Charles