Assumptions
The t distribution provides a good way to perform one-sample tests on the mean when the population variance is not known provided the population is normal or the sample is sufficiently large so that the Central Limit Theorem applies (see Properties 1 and 2 of Basic Concepts of t Distribution).
It turns out that the one-sample t-test is quite robust to moderate violations of normality. In particular, the test provides good results even when the population is not normal or the sample size is small, provided that the sample is reasonably symmetrically distributed about the sample mean. This can be determined by graphing the data. The following are indications of symmetry:
- The boxplot is relatively symmetrical; i.e. the median is in the center of the box and the whiskers extend equally in each direction
- The histogram looks symmetrical
- The mean is approximately equal to the median
- The coefficient of skewness is relatively small
The impact of non-normality is less for a two-tailed test than for a one-tailed test and for higher alpha values than for lower alpha values.
The other assumption for the t-test is that we have a random sample. If, for example, we are interested in the mean cholesterol level of a population, then our sample must consist of the cholesterol levels of people chosen at random. We can’t use the t-test for a sample consisting of cholesterol levels for the same person at different points in time.
One-tailed t-test
Example 1: A weight reduction program claims to be effective in treating obesity. To test this claim 12 people were put on the program and the number of pounds of weight gain/loss was recorded for each person after two years, as shown in columns A and B of Figure 1. Can we conclude that the program is effective?

Figure 1 – One sample t-test
A negative value in column B indicates that the subject gained weight. We judge the program to be effective if there is some weight loss at the 95% significance level. Usually, we conduct a two-tailed test since there is a risk that the program might actually result in weight gain rather than loss, but for this example, we will conduct a one-tailed test (perhaps because we have evidence, e.g. from an earlier study, that overall weight gain is unlikely). Thus our null hypothesis is:
H0: μ ≤ 0; i.e. the program is not effective
Testing Assumptions
From the box plot in Figure 2, we see that the data is quite symmetric and so we use the t-test even though the sample is small.

Figure 2 – Box plot for sample data
Test Results
Column E of Figure 1 contains all the formulas required to carry out the t-test. Since Excel only displays the values of these formulas, we show each of the formulas (in text format) in column G so that you can see how the calculations are performed.
We see that n = 12, x̄ = 4.67, s = 11.15 and s.e. = s ⁄
![]()
with df = 11 degrees of freedom.
Since p-value = T.DIST.RT(t, df) = T.DIST.RT(1.45, 11) = .088 > .05 = α, the null hypothesis is not rejected. This means there is an 8.8% probability of achieving a value for t this high assuming that the null hypothesis is true, and since 8.8% > 5% we can’t reject the null hypothesis.
The same conclusion is reached since
tcrit = T.INV(1-α, df) = T.INV(.95, 11) = 1.80 > 1.45 = tobs
Note that if we had used the normal distribution for the hypothesis testing as described in Sampling Distributions we would have gotten the following result:
NORM.DIST(x, μ, σ, TRUE) = NORM.DIST(4.67, 0, 11.15, TRUE) = .926 < .95 = 1 – α
This would again show that the null hypothesis can’t be rejected. We see that the probability of being in the critical range is .074 compared to .088 in the t-distribution case. In fact, the large sample test (via the normal distribution) is not as accurate as the small sample t-test.
Two-tailed t-test
Example 2: A school board wanted to see if reading test scores have changed in the past 30 years by testing a random sample of 40 students to see whether there is a significant change from the average score of 78 thirty years ago. The scores in the sample are shown in Figure 3.
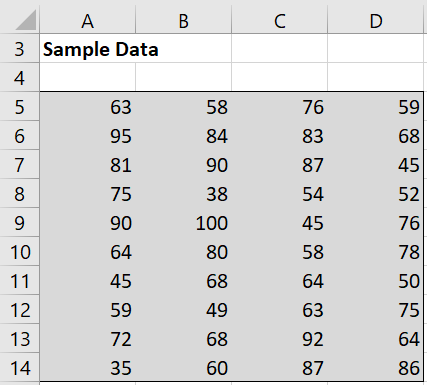
Figure 3 – Random sample data
Based on this data, can we claim that the reading scores have changed in the past 30 years?
We will test the two-sided null hypothesis:
H0: µ = 78
Normality Assumption
From Excel’s Histogram data analysis tool, we see that the data is reasonably symmetric. This is confirmed by Excel’s Descriptive Statistics data analysis tool since the mean and median are approximately equal and the skewness is close to zero (see Figure 4). This justifies the use of a t-test.
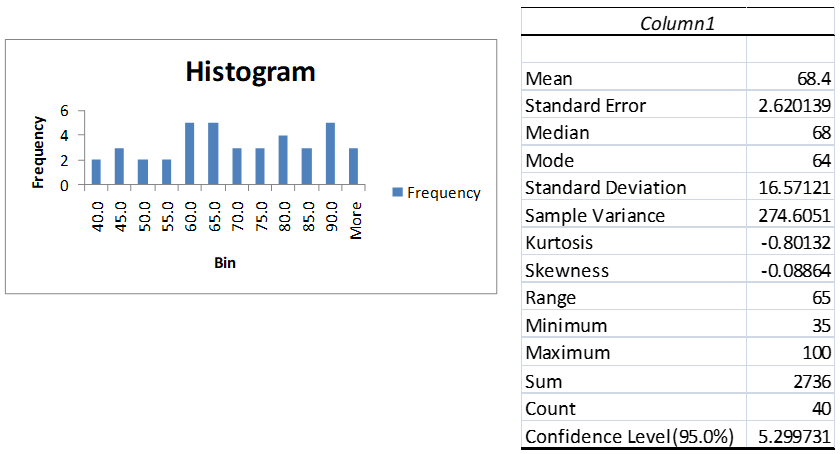
Figure 4 – Testing for symmetry
Actually, we can use the QQ-Plot and Shapiro-Wilk options of the Real Statistics Descriptive Statistics and Normality data analysis tool, as shown in Figure 5, to demonstrate directly that the data satisfy the normality assumption.
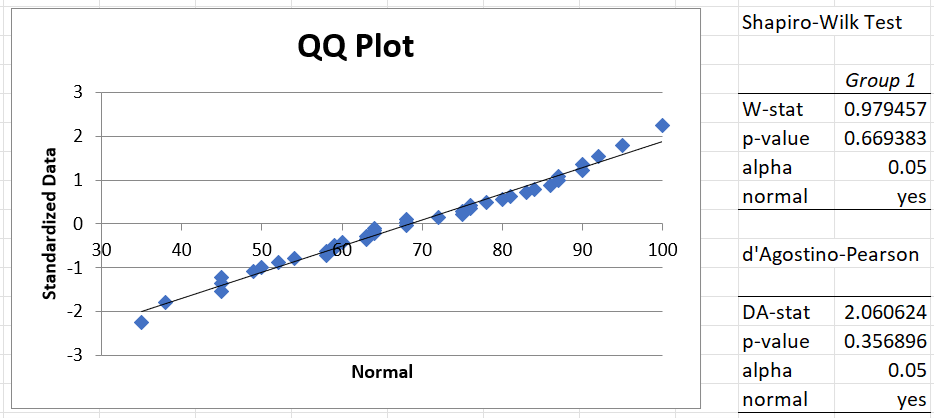
Figure 5 – Testing for normality
Data Analysis Tool
This time we will use a Real Statistics data analysis tool to perform the analysis.
Real Statistics Data Analysis Tool: The Real Statistics Resource Pack provides a data analysis tool called T Tests and Non-parametric Equivalents, which provides access to the t-test for one sample, two independent samples, and paired samples, as well as the non-parametric equivalent tests (Mann-Whitney and Wilcoxon Signed-Ranks tests).
For Example 2, enter Ctrl-m and select T Tests and Non-parametric Equivalents from the menu (or from the Misc tab when using the Multipage interface). A dialog box will appear as displayed in Figure 6.

Figure 6 – Dialog box for T Tests and Non-parametric Equivalents
Enter A5:D14 in the Input Range and 78 for the Hypothetical Mean/Median, unclick Column headings included with data, and choose the One sample and T test options. When you click on the OK button, the output shown in Figure 7 is displayed.
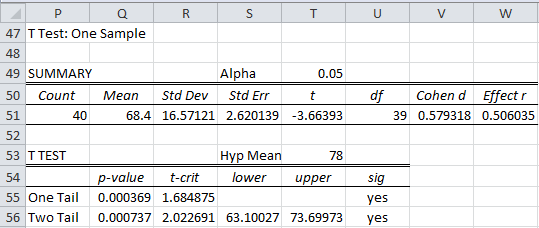
Figure 7 – Real Statistics one-sample t-test
Analysis
From the figure, we see that
![]()
with n – 1 = 39 degrees of freedom.
Thus, p-value = T.DIST.2T(ABS(t), df) = T.DIST.2T(3.66, 39) = .00074 < .05 = α, and so we reject the null hypothesis and conclude there is a significant change (i.e. reduction) in the test scores.
Alternatively we can calculate, tcrit = T.INV.2T(α, df) = T.INV.2T(.05, 39) = 2.02. Since |tobs| = 3.66 > 2.02 once again we reject the null hypothesis.
Note that in Excel 2007 we calculate p-value = TDIST(t, df, 2) = TDIST(3.66, 39, 2) = .00074 < .05 = α.
The input data for the one-sample t-test can have missing data, indicated by empty cells or cells with non-numeric data. Such cells will be ignored in the analysis.
Worksheet Function
As described in Paired T-Test and Two-Sample T-Test, Excel provides a T.TEST function that supports paired-sample and two-sample t-tests, but not the one-sample t-test. The following Real Statistics function fills in this gap.
Real Statistics Function: The Real Statistics Resource Pack provides the following function:
T1_TEST (R1, hyp, tails) = the p-value of the one-sample t-test for the data in array R1 based on the hypothetical mean hyp (default 0) where tails = 1 or 2 (default).
For Example 2, the formula T1_TEST(A5:D14, 78, 2) will output the same value shown in cell Q56 of Figure 5, namely p-value = .000737.
Confidence interval
As described in Confidence Intervals for Sampling Distributions, we can define the confidence interval associated with the t distribution as
observed mean ± tcrit ⋅ std error
Example 3: Calculate the 95% confidence interval for Example 2
meanobs ± tcrit ⋅ std err = 68.40 ± 2.02 ⋅ 2.62 = 68.40 ± 5.30
This yields a 95% confidence interval of (63.10, 73.70). Since the interval doesn’t contain the hypothetical mean of 78, once again we are justified in rejecting the null hypothesis (with 95% confidence).
Note that the endpoints of the confidence interval, 63.10 and 73.70, are displayed in cells S56 and T56 of Figure 7.
Excel Function
Versions of Excel starting with Excel 2010 provide the following function to calculate the confidence interval for the t distribution.
CONFIDENCE.T(α, s, n) = k such that (x̄ – k, x̄ + k) is the confidence interval of the sample mean; i.e. CONFIDENCE.T(α, s, n) = tcrit ∙ std error, where n = sample size, s = sample standard deviation and 100(1 – α) is the confidence percentage.
For Example 2, CONFIDENCE.T(.05,16.57,40) = 5.30 which yields a 95% confidence interval of (68.40 – 5.30, 68.40 + 5.30) = (63.10, 73.70). The same result was obtained from the T Test and Non-parametric Equivalents data analysis tool, as shown in range D56:T56 of Figure 5.
Observation
Excel’s Descriptive Statistics data analysis tool has an option for generating the confidence interval for a sample or collection of samples using the t distribution. Referring to Figure 2 of Descriptive Statistics Tools, to choose this option click on the Confidence Interval for Mean checkbox and specify the confidence percentage (i.e. 1 – α) if you want to override the default of 95%. E.g. from Figure 4, we see that the 95% confidence interval value in the Descriptive Statistics output for the data in Example 2 is 5.299731.
Real Statistics Functions
The Real Statistics Resource Pack provides the following functions:
STDERR(R1) = standard error of the data in the range R1 = STDEV(R1) / SQRT(COUNT(R1))
CONFIDENCE_T(α, s, n) – equivalent to CONFIDENCE.T(α, s, n); useful for Excel 2007 and earlier versions of Excel
T_CONF(R1, α) = k such that (x̄ – k, x̄ + k) is the 1 – α confidence interval of the sample mean for the data in range R1 based on the t distribution
T_LOWER(R1, α) = the lower end, x̄ – k, of the 1 – α confidence interval of the sample mean for the data in range R1 based on the t distribution
T_UPPER(R1, α) = the upper end, x̄ + k, of the 1 – α confidence interval of the sample mean for the data in range R1 based on the t distribution
If α is omitted it defaults to .05. These functions ignore any empty or non-numeric cells.
One-tailed Confidence Interval
Example 4: Calculate the one-tailed 95% confidence interval for Example 1.
Since the null hypothesis is H0: μ ≤ 0, the one-tailed confidence interval for the population mean takes the form
(x̄ – s.e. ⋅ tcrit, ∞)
where tcrit is the one-tailed critical value From Figure 1, we see that
x̄ – s.e. ⋅ tcrit = 4.66667 – 3.220048 ⋅ 1.795885 = -1.110616
Since 0 lies in the confidence interval (-1.11616, ∞), we again conclude that there isn’t sufficient evidence to reject the null hypothesis.
Note that if the null hypothesis were H0: μ ≥ 0, then the one-tailed confidence interval would be
(-∞, x̄ + s.e. ⋅ tcrit)
Prediction interval
Suppose that the mean and standard deviation of a random sample of size n are x̄ and s, respectively. We can then estimate the mean of a new sample of size m to also be x̄. The precision of this prediction would then be
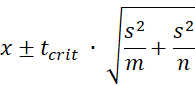
This is called the 1 – α prediction interval.
Example 5: Calculate the 95% prediction interval of one additional data element randomly selected from the population from Example 2.
From Figure 7, we see that x̄ = 68.40, s2 = 274.6051, n = 40, and tcrit = 2.0227 (two-tailed with α = .05). Thus the 95% prediction interval for one additional data element is
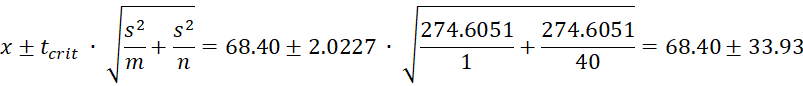
and so the prediction interval is (34.47, 102.33). Note that the prediction interval for the mean of another random sample with 40 elements would be (60.91, 75.89), which would be a narrower interval. In any case, this is wider than the 95% confidence interval of (63.10, 73.70). In fact, it is easy to see that the prediction interval is always larger than the confidence interval.
Effect size
Click here for a description of Cohen’s d and Hedges’s g effect size measures for the one-sample t-test. In addition, an estimate of the confidence interval for Cohen’s d is provided.
Statistical Power and Sample Size
Click here for a description of how to calculate the power of a t-test using the same approach as we did in Power of a Sample for the normal distribution. We also show how to estimate the minimum sample size required for a one-sample t-test.
In Statistical Power of the t Tests we show another way of computing statistical power using the noncentral t distribution.
Examples Workbook
Click here to download the Excel workbook with the examples described on this webpage.
References
Howell, D. C. (2010) Statistical methods for psychology (7th ed.). Wadsworth, Cengage Learning.
https://labs.la.utexas.edu/gilden/files/2016/05/Statistics-Text.pdf
Nelson, S. L. and Nelson, E. C. (2016) How to use the t-test data analysis tool in Excel
https://www.dummies.com/article/technology/software/microsoft-products/excel/how-to-use-the-t-test-data-analysis-tool-in-excel-152093/
Zar. J. H. (2010) Biostatistical analysis 5th Ed. Pearson
Dear Sir
Thank you.
Kind regards
V.Valavan
Dear Sir,
One more question from my side. Please clarify it.
If Population is not normal, and σ known, but sample size is small (n=30 or n=30 or n=30), Use test statistic Z
3.2: If Population is not Normal, σ known, Sample size is small (n=30 or n<30), Use test statistic T
Please let me know this concept is right?
Vlavan,
If σ known and population is not normal, then neither the z test or t test is appropriate.
Charles
Dear Sir
Thank you so much.
Kind regards
Vlavan
Thanks for this.
I did a short educational program with 20 students and had a five question pre test, and post test. I want to do a test with the overall average of the scores pre and post, and then an average of the score for each question. Is the method the same as the t-test paired two samples for means? Meaning, I would need to type the scores for each student pre and post overall, and then individually for each question?
Kay,
What hypothesis are you trying to test?
Charles
Dear Sir for comparing mean (one or two sample/s) or for non normal population that variance is known or unknown , we can use test statistic Z provided sample size n is more than or equal to 30, as per the central limit theorem, ( we can replace s instead of sigma, if sigma is unknown).
Is it right?
if sample size is small (n<30), population variance is known or unknown of the non-normal distribution, shall we have only way to do non parametric method to compare the mean?
Please give answer to these questions. I am earnestly waiting for the answer
Vlavan,
The statement in the first paragraph of your comment is generally correct. The number 30 is an estimate.
When the variance is not known it is better to use the t test. This works for small or large samples. It is better since the test explicitly uses the sample variance and. It is certainly better for small samples.
The t test is also relatively robust to violations of normality. When the sample is clearly not normal (e.g. heavily skewed), then you might consider using a nonparametric test.
Charles
Sorry Charles, last question 🙂
In Figure 14 above, why are the two t-distribution not the same? For H0 and H1, we need a t(n-1) distribution centered on the origin, don’t we?
Again, many thanks in advance!
Fred
Fred,
The blue curve represents the t distribution assuming that the null hypothesis is true. The red curve represents the t distribution assuming that the null hypothesis is false (i.e. the alternative hypothesis is true). They are not the same.
Charles
Yes but in both cases we are a looking at a t-distribution with the same degrees of freedom, the T statistic value changes but the distribution is the same? Thanks!
Fred
Fred,
Actually, you are using a version of the t distribution called the noncentral t distribution, as described on the following webpage:
https://real-statistics.com/students-t-distribution/noncentral-t-distribution/
Charles
All makes sense now, thanks!
Hello again Charles,
For a 2-tailed test you seem to be doubling the alpha value, for instance if alpha=0.05 for a one tail test, you would use 0.10, so 0.05 in both tails. I have also seen people use alpha=0.025 in each tail (so 5% in total). Is there any best practice for that?
Many thanks!
Fred
Sorry, I just realized it might be due to the way Excel’s T.INV() handles quantiles compared to TINV()
Hello Every One,
I have a got a vale which is a mean of 5 observations. I have lost the data of number of observations (5).
Is there any formula in excel through which I could get the values of expected observations by specifying the standard deviations.
Regards
Rizwan Ali Ansari
email: rizwans.ansari@gmail.com
Rizwan,
Having the mean and standard deviation is not enough to calculate the 5 observation values.
Charles
Hello,
I have one column containing a 1 or a 0 according to the respondent’s sex.
A second column has the data about the IQ of the respondent.
How do I run a t-test between the boys and the girls?
I don’t want to have to create new columns with boys only or girls only.
Thanks!
Mark
Mark,
Suppose that the range with the 0s and 1s is A1:A100 and the range with the IQs is B1:B100, then you can conduct a two-tailed t-test (assuming heterogeneous variances) using the array formula: =TTEST(IF(A1:A100=0,B1:B100,””),IF(A1:A100=1,B1:B100,””),2,3).
Charles
Hello sir I m doing Final year MBA and Sir my final year project Topic is Long Run Performance of Right Issues and Its Effect on Share Performance, so Sir can u please suggest me which test and statistical tools i m suppose to conduct to fulfill my Objectives
with the data i have collected is 10 firms offering Right issues, i have the firm’s 60 months Volume traded and Adj close data and for my second objective i have data of firm’s share price 20 days before Right issue offer and 20 days after right issue offer
so sir can u please help me out
Vibhav,
You reference two objectives. What are these objectives?
Charles
Thank you charles. The middle term of the 5 point likert scale (3) is what I planned to use as the fixed score.
Thank for your prompt reply. Here I will try to describe the challenge I encountered. As I mentioned last time the dependent variable of my topic is “market share” which I couldn’t collect data on, because the subject company is single. So I developed a questinnaire (with 5 point likert scale, Interval data type) having questions like: 1. Product Quality has a significant effect in improving market share of the subject company. 2. Increasing product variety has a significant effect on improving market share of the subject company. 3. Good product packaging has a significant effect on improving market share of the subject company. And the like…… By the way the independent variables are 4Ps(product, price, promotion, and place) of the marketing mix. I planned to use a one sample t-test, to compaire a hypothesised mean to the population mean. Would yuo please give me advise on whether and how I can do this?
If I understand correctly, you are going to do a number of one-sample t tests. In each t test you will compare the mean score from the questionnaire against some fixed score. Is this your approach and what do you plan to use for the fixed scores?
Regarding how to conduct the one-sample t test, this is described on the referenced webpage, and on further examples elsewhere on the website.
Charles
Hi, sir. I am a final year MBA student. My thesis topic is “the effect of marketing mix elements on market share” since the subject company is single, I couldn’t collect the dependent variable. So I used 17 questions of 4 independent variables with 17 sub variables. Would you please tell me how I can use a one sample t-test?
Hello Charles,
I have a data set of returns and I want to know if the data is significant to tell whether the mean is less than 0. Would I use t.dist.rt or t.dist? In your example one above, I don’t understand why you are using t.dist.rt rather than t.dist.
Also, let’s say that I can reject the null that the data’s mean is less than 0. How would I then test whether or not the mean is greater than 0? Is it simply using the opposite test? IE, if I use a t.dist for less than 0, would I then just run it using t.dist.rt for mean greater than o?
Thank you!
Austin,
I am not sure which of the examples on the referenced webpage you are referring to. In any case, T.DIST.RT is just 1 – T.DIST, and in some sense it really doesn’t matter which function you use. The more important issue is which tail you use, the left or the right.
Charles
Hi,
Can I ask what is the difference between one sample t-test and one-sample chi-square test? Is this the case that t-test works on parametric variables and chi-square test works on nonparametric variables?
Thanks!
Sichao,
The tests are quite different, as you can see by looking at the details of each test on the Real Statistics website.
I don’t know what you mean by parametric and nonparametric variable, but the t test is a parametric test, while chi-square is a non-parametric test. The non-parametric version of the t test is not the chi-square test, but the Mann-Whitney test.
Charles
Thank you so much, Charles!
How do you do a one sample hypothesis test for the proportion using real statistics?
Jay,
See https://real-statistics.com/binomial-and-related-distributions/proportion-distribution/
Charles
Hi Charles
Thanks for your very useful info.
Here’s a question for you: Is it possible to carry out a t-test with n=1 sample size?
I have a known population (n=52, mean 0.25, std dev 0.20), and a sample of one (value 1.25). I’d like to test whether that single sample is statistically different from the population. Can this be done?
Many thanks
Michael,
In general you can perform testing with very small samples, but you shouldn’t expect too much from the results. In the case of a t-test, it is impossible to do this test with a sample with one element since df = n-1 = 1-1 = 0.
Charles
Thanks Charles.
Is there any other statistical test I could use to test a single sample against a population?
Cheers
Another choice is the Wilcoxon Signed-Ranks Test.
Charles
How can we use the Wilcoxon Signed-Ranks Test in this case? I have tried in Graphpad Prism but it says it requires at least n=2 in each group.
Spiros,
Sorry, but I don-t know what case you are referring to.
In any case, you can-t use the Wilcoxon Signed/Ranks Test if n = 1.
Charles
I need help fellows, How could I set a plot test when working with one treatment Example in testing adaptation for the new seed variety entered your Country?
You need to provide more information before I can answer your question. Also, by plot test do you mean a test plot for normality?
Charles
Hi Charles,
You use this method for the 1 sample test, but the method based on the non central t distribution for the 2 sample tests.
Is it possible to use either method on either type of test? If not, why?
Thanks,
Jonathan
Jonathan,
You can use either method on both tests.
Charles
Thank you Charles.
I’m currently trying to determine the Beta and Statistical power for all the examples here in order to hone my intuition for these things.
I tried to calculate the Beta/Power for example 1 on this page with this data for a 2-tailed test:
C.I: 7.0872 (2.20098*3.22)
Xcrit: 7.0872 (0 + C.I.)
T: 0.7517 (7.0872-4.66/3.22)
Beta: 0.46799 – TDIST(0.7517, 11, 2)
Power: 0.532 (1-Beta)
However, if I use T1_Power or the RealStats tool the Power of this test is 0.26304.
As far as I can see I’m using the method listed on this page correctly so I’m not sure why my results are different if you can use either method interchangeable. (I’m assuming T1_Power uses the NCT method to determine the Power).
Jonathan,
My calculations are different from yours. I have done this quickly and so perhaps I have made a mistake, but I get the following:
t-crit 1.795884819
x-crit 5.782829113
mean 4.666666667
t 0.346629505
beta 0.632295153
power 0.367704847
This not the same as the answer using the noncentral T distribution, although it is closer than the value you calculated. I can’t recall whether the assumptions are different and so the values may not be identical.
Charles
Hi Charles,
For example 1, you list the Tcrit value as 2.200 in the excel diagram, but since it’s a 1-tailed test shouldn’t it be 1.80 since you need to do 2*P? (You use the 1.80 value later on in your explanation).
Jonathan,
You are 100% correct. For some reason, the examples workbook contains the correct calculations, but the website doesn’t. I have just corrected the webpage.
Thanks for catching this error. Your help is most appreciated.
Charles
Dear sir i have a data for 5 years relating to growth of deposits in bank i have to find weather growth is significant or not how it is possible
1. 702.79
2. 753.55
3. 758.56
4. 887.32
5. 1108.73
please help me in this regard i will be thankful to u
Mustaq,
You need to better define what you mean by growth. Do you mean that the values increase or do you mean that they increase exponentially, etc. etc.? Once you have determined which model of growth you are using then you can use the appropriate statistical test. E.g. if you are looking at exponential growth then you can use an exponential regression model, as described on the webpage Exponential Regression.
Charles
Dear Charles,
I am writing my bachelor thesis in finance. I am testing whether an active trading strategy is better than a buy & hold strategy. Both strategies have the same stocks but the active strategy buys a stock when you have a buy signal from a technical indicator “the moving average” and vice versa, sell the stock when there is a sell signal. After a sell signal, you buy a treasury bill with a risk free rate until a new buy signal.
The buy and hold strategy just buys the stocks on the first day and keeps it until the last day. I want to test if the active strategy is better.
I have 212 stocks with daily closing prices during 20 years and have calculated the monthly returns. I am thinking about comparing the difference between the monthly returns by just calculating the difference for each month and then put all differences in a one sample t-test assuming the mean to be 0.
Am I doing this correct?
Best regards, Per Forsberg from Stockholm, Sweden
Dear Per,
It sounds like you have two factors: the 212 stocks and the 240 monthly returns. Perhaps you are combining the returns on all 212 stocks each month. In this case you could use the t test on the differences of the 240 monthly returns. Stock prices from one month to another aren’t completely independent (i.e. there is autocorrelation), but since you are taking the differences perhaps this approach is valid.
Charles
Hi Charles,
I have posted this question on another section of your website, i am reposting here since it is affecting all your real statistics functions. When I call the dialog box thorugh Ctrl+m, and try to run for example a t-statistic on one of your real statistics examples, say weight loss, i get the following error:
—————————
Microsoft Excel
—————————
Alpha must be a number between 0 and .5
I have tried all values within that range, including the 0.05 default option to no success.
Can you please help me debug this issue so i can use your tools.
Best
Dimitris
The usual reason for this error is that you are using comma instead of period as the decimal symbol. In this case, you need to enter 0,05 instead of 0.05. If this what is already written in the field just re/enter the value manually.
Charles
Dear Charles,
I have the same problem as Dimitris. I tried all values within that rage, I put as 0.05 as 0,05, but it still doesn’t work. Could you please help to fix this bug?
Victoria,
Did you try re-entering 0.05 as 0.05 (i.e. manually writing the exact same value)?
What language does your Excel use?
I will try to finally fix this problem which has plagued me from the beginning, but for now please try the above approach and see whether it works.
Charles
Hi Charles,
I also have the same problem. I use the South African/Afrikaans locale in Excel.
However, your solution (to use a comma) worked in my case. It would be great, however, it the problem could be fixed permanently, so that I don’t have to enter values manually.
Thanks for your help!
Gerhard
Gerhard,
I plan to introduce what I hope to be a solution in the next release of the software.
Charles
Last question for tonight: In Figure 4, what is the formula used to get that 5.299731 for the 95% confidence Level?
John,
=CONFIDENCE.T(0.05,s,n) where s = the standard deviation = 16.57 and n = sample size = 40.
Charles
In the Calculation of Power section, you have cell I24 = .870985. Using your numbers and even putting your numbers directly into the TDist formula (=TDIST(1.159795,23,1)), I get the same answer every time: 0.129015. I can’t work it out so it gets what you got (.870985). How are you getting that??
(For those pics, did you use the GETFORMULA UDF to show the formulas? Because for at least I24, the formula you are showing isn’t the formula that is being used to calculate that cell.)
John,
The formula used is T.DIST(1.159795,23,TRUE) not =TDIST(1.59795,23,1). T.DIST is the Excel 2010/2013/2016 version of the TDIST function. Actually, I used the Real Statistics function T_DIST, which is identical to T.DIST except that it is available even for versions of Excel prior to Excel 2010.
Note that =TDIST(1.59795,23,1 is equivalent to =1-T.DIST(1.159795,23,TRUE)
Generally I use the Real Statistics function FTEXT to show a formula as text. Sometimes, I use an Excel 2007 formula, but show the Excel 2010 or Real Statistics version of the same formula.
Charles
I am confused about something: 1) When the population variance (sigma-squared) is known, we can use Cohen’s d as an estimate of effect size where d = abs (sample mean – population mean)/ Isn’t sigma the symbol for population standard deviation?? Above is talking about population variance (?))
2) I think you need more symbols to explain these. Like this: “When the population variance (sigma-squared) is unknown, we can use the sample standard deviation (s) as an estimate of the population standard deviation (sigma)”
John,
If the population variance is known then the population standard deviation is also known since this is the square root of the variance. Sigma is the symbol for the population standard deviation.
Charles
thank you very much. the service you given through this forum is priceless for the student like me who learn statistics. great service
Dear charles,
Again I back due to problem of reliability test of my data. Before doing Hotelling t test I did Cronbach alpha test for reliability and got negative value for it. then, still can I use Hotelling t test.
as you mentioned, only the normality test is sufficient for t test ? what can I do if I got negative Cronbach alpha value (value is greater than 0.70).
Nirosha
You should be able to use Hotelling’s test no matter what value you got from Cronbach’s alpha, but if your questionnaire is unreliable, you might question the value of any results you get as a result of the questionnaire.
A negative value for Cronbach’s alpha can mean that your questionnaire is testing more than one thing. If this isn’t your intention then you may need to reword some of your questions or remove one or more questions. You can use Cronbach’s alpha with one question removed to determine whether this will be helpful.
Charles
Thanks, I will briefly explain my problem. I selected 30 Agricultural extension officers to measure their information link with other actors in the sectors such as farmers, research officers, etc.
and Used seven variables to measure their perception towards the information link with others. ex:
I have frequent link with Research officers , I have update meeting once a month with research officers … etc and licket scale range highly significant link (+2) ; to (-2) no any significant link.
finally, I tried to test overall one hypothesis using all theses variables
and H1: I have significant information link with other actors of the network.
can i made such hypothesis using multiple variables?
because, when i run one sample t test, I got t values for each variables and some are significant and some are not.
then, I do not know how to test above hypothesis using each individual value
is their any methods to take value of total variables and test my above hypothesis.
I am sorry , I am very poor in statistical analysis and looking forward hearing from you
If you want to take more than one variable into account, you can use Hotelling’s T-square test. See the webpage
Hotelling’s T-square.
Charles
Dear Charles,
thank you very much. I think i can use SPSS for the analysis and it is under reliability analysis.
if so, can I use it to hypothesis testing ?
I am apologizing for continues inquires
Nirosha
Dear Nirosha,
Since I don’t use SPSS I can’t say how it is organized.
Charles
Ok. thank you very much for your candid support.Now I can follow your methods even without SPSS.
thanks for you great help again.
Nirosha
Hi, I am struggling to use my licket scale data with t- test, I want to test attitudes of AI officers using seven variables with 5 point licket scale. can I use one sample t test to test hypothesis of there is a significant effects of AI officers attitudes towards relationship with farmers.
how I test one hypothesis using seven variables. I got t value for each variables.
How I test my hypothesis
thanks
what hypothesis are you trying to test?
Charles
hi… isnt t-test ,the one that is limited to a sample size of 30 ?! unlike the 40 samples in example 2 ?
The t test is not limited to samples of size 30.
Charles
Dear Charles,
I have data from 82 respondents on a survey that measures service quality. The survey has two sections: Expectations and Perceptions, scores for both sections are in the form of likert responses. I want to show that there is significant difference between expectations scores and perceptions scores. I have seen from previous literature that researchers have made use of parametric tests like the t-tests to prove this significance in their research. However I am unable to identify what kind of t-test exactly to use and how to use it for my research.
Could you please advise on what kind of t-test i can use to prove the significance of difference between the expectation and perception scores.
Thanks
Also, each section has 22 statements, so 22 statements under expectations and 22 statements under perceptions measuring the same 22 variables in both sections
If the same 82 respondents fill in both parts of the survey, then the appropriate t test is a paired samples t test.
Since you are using a Likert scale, there is some question as to whether the normality assumption of the t test will be met. If not, you should use the nonparametric version of the t test, namely Wilcoxon signed ranks.
You also mention that each section has 22 statements, in which case the choice of test depends on which scores you are comparing. If, for example, you add up the 22 Likert scores for each section (for each respondent), then you will get a score which can be considered to be continuous, in which case, it is likely that the t test assumptions will be met and so you can use the t test.
Charles
Thank you for this Charles.
On another note, can I please ask you to clarify my problem with a reliability test that I carried out for this survey. The cronbach’s alpha values were in the range of 0.73 to 0.90 for the pilot tests on 10 responses, deeming the scale to be reliable. However, when I ran a reliability test post survey with 82 responses, the cronbach’s alpha’s ranged from 0.57 to 0.83. What inferences can I make about this for my research.
Thanks
I am quite new to statistical analysis and to the latest version of Excel, as I last did number crunching in the days of Windows 95. I have recently had to relearn all this stuff and was expected to use Minitab, which I dislike. There is so much rubbish on the internet, and many students have to spend hours ploughing through it to find anyhting of value. This site is incredible. The quality of the resources is superb, the style of writing, the layout, the exposition, all first rate. I don’t know how you do it. Keep up the good work.
Thank you Marcus for your support. I do expect to keep adding to the website and improving the software.
Charles
Hi Charles, Thank you very much for this article, very useful!
Have a question and would like to know your opinion:
For my business, I am measuring on-time performance. I have a data of deliveries and want to set up the right transit time for planning. At the moment, I am caring only if truck is late. Would you advise me on distribution and test should I use?
about 150 trucks are in data set, mean – 24, st dev – 10, confidence level needed – 85%
Thank you a lot!
I just performed normality test – and data is skewed to the right.
Any ideas on the further actions?
Michael,
It depends on how skewed the data is, but you can simply use the Wilcoxon signed rank test instead of the t test.
Charles
Michael,
What hypothesis do you want to test?
Charles
Charles,
I need to set up the value that would capture of 85% of arrivals.
I digged into the data and it appeared that there are 2 picks which can be easily described: if warehouse didn’t manage to do it on time, it arrives to our store the next day. So there is a gap in between.
Really have no idea how to measure.
Thank you!
Michael
Michael,
Unfortunately, this doesn’t tell me what hypothesis you are trying to test. I don’t understand the problem you are trying to solve well information to give you any advice.
Charles
As I understand it will be H0 (Hyp. 0) – that hyp. mean is < than real mean with confidence level 85%. Though I am not very sure about it…
Fantastic, really clear explanation, thank you very much.
Thank u Sir 🙂
Hi Sir,
How different should the variances be to abandon Student’s T-test and go for Welch’s? I got samples with different variance differences (some around 20, some 3). Also, if the variances do not differ by much, is it OK to do Student’s T-test despite the large sample size?
Meera.
Meera,
I tend to always use the t test with unequal variances instead of the t test with equal variances since if the variance are pretty close then the two tests give almost the same results anyway. In my experience unless the variances are really different (say one is more than 4 times the other), the tests give almost the same p-values.
I don’t see any reason not to use the t test with a large sample size.
Charles
Dear Sir,
Should I opt for Welch’s t-test instead of Student’s since my N is way more than 30 (sample size=384)? Also, is it OK to calculate ANOVA with samples of unequal length?
Regards,
Meera.
Meera,
If by Welch’s t test you mean the t test with unequal variances, then the fact that N is large is not the determining factor for using Welch’s t test. You should use Welch’s t test when the variances of the two samples are very different.
Yes, you can use ANOVA with samples of unequal size. The websitre shows you how to do this. When samples are of unequal size, the test is less robust to violations of the assumptions (esp. unequal variances).
Charles
Dear Sir,
I’m back seeking more help. I’m studying the errors made by non-native speakers of English in my state. Did a survey of sample size 384. The mean error = 12.43229, Standard deviation =5.397572. I wanna say that the sample mean can be applied to the population. Am thinking about a single sample t-test. But there has been no previous study, so i got no population mean 2 apply. What should be my null hypothesis? I hv read the ones in examples 1 & 2 but they are different from my situation. Plz do help.
Regards,
Meera.
Meera,
As you have said, unless you are comparing to some other study or result, there is no t test to perform.
It sounds like mean error = 12.43229 and Standard deviation =5.397572 captures the situation.
Charles
Thank u Sir. Guess I’ll just find out the confidence interval and leave it at that.
Meera
Hi Mr. Charles,
I’m doing a thesis regarding the significant decrease of index value in stock market during August for the so-called ‘Ghost Month Effect’. In my methodology, I test the monthly data for 20 years(1994-2013) and recorded if there is decrease that occurred for a particular month and afterwards made a table summarizing the total no. of times(out of 20 years) that a particular month had.
However, before counting the no. of declines I first assured that the decline that happened is significant using one-sample t-test(one tailed).I used the t-test for the difference of the daily data for each month and below is a sample result.
May 1995: Mean of the sample=14.5952381, t-statistic=1.908295131, t-critical=1.724718243
June 1995:Mean of the sample=-0.281904762
, t-statistic=1-0.065582771, t-critical=1.724718243
Ho=0
Ha or < the t-critical regardless of the sign of the sample mean. Hope you can enlighten me.
Thanks,
MJ
MJ,
Your random variable seems to be x = the difference of the daily stock market index (for a given month). I don’t know what H0=0 means. Does this mean that the mean value of x is 0? This would indicate that if you have one big decline in the month it could have as much weight as a lot of small increases in the month (as opposed to testing whether on average half the days are declines and half are increases). I don’t understand what any of this would mean towards proving (or disproving) your original hypothesis that there is a decline in the indices in August.
A simple approach could be to use the t-test (or Mann-Whitney if the assumptions don’t hold) to see whether there is a significant difference between the index on the first of the month and last day of the month for 20 years, comparing say July with August. I can think of other approaches that could be suitable as well.
Charles
Charles can you please explain me why do we use one sample T-test. what exactly it is used for. Can i use it for likert scale. How to interpret the result of One sample T-test
As explained on the referenced webpage, the one sample t test is used to determine whether the mean of a population is significantly different from some fixed value. Examples 1 and 2 on the referenced webpage give examples of when the test is used. The data should be continuous, but the test can be used with ordered discrete data (such as Likert scale) provided the other test assumptions are met.
Charles
Hi Charles,
I am pretty good with finding the mean and standard deviations, but I am struggling to answer this question for class. Could you please help me.
The vast majority of the world uses a 95% confidence in building confidence intervals. Give your opinion on why 95% confidence is so commonplace. Justify your response.
Construct a hypothetical 95% confidence interval for a hypothetical case of your choosing. Use your own unique choice of mean, standard deviation, and sample size to calculate the confidence interval. Select one (1) option provided below and analyze what will happen to your confidence interval based on the option you selected:
The confidence changes to 90%.
The confidence changes to 99%.
The sample size is cut in half.
The sample size is doubled.
The sample size is tripled.
Daniel,
I would prefer not to do your homework assignment for class. You should do this yourself.
I will give you a hint though. Try answering the questions using an actual example. You can use one of the examples on the referenced webpage.
Charles
Helloo, I have to do statistical analyses about this hypothesis
Using social network havw positive inpact on modeling altruistic behavior in adolescents
but i dont know which analyses to use could you give me some coments about this.
You need to provide more information about what you are trying to test before I can answer your question.
Charles
Hi,
I have a question about the confidence interval. I ran a test on a set of sample data which produced the following data:
Average = 0.74%
Degrees of freedom = 117
Standard Deviation = 0.0219
Standard Error = 0.00203
Assuming that the total average is zero (\mu) , I get the statistics:
t-Value = 3.651
p-Value = 0.00068 (using excel T.DIST with probability density function)
Now if I want to create a confidence interval for the average the following month, within 95% (the alpha in this case is 0.05 which would reject the hypothesis, since p-Value < alpha). But doesn't this mean that I can create a confidence interval of 0.99932 making my alpha 0.00068 (which would not be rejected)?
That is, choosing a larger confident interval will make the hypothesis to be not rejected? Or have I gotten it wrong?
Hi Daniel,
Rejecting the null hypothesis with a p-value of .00068 does not mean that the confidence interval is .99932 (whatever that means). The confidence interval is (.74-.00203*d, .74+.00203*d) where d = TINV(.05,117).
Charles
Dear Charles,
Thank you very much for your information. I am currently using T-test to test my result.
Now I am not sure if I did it correct. I have a set of data as one sample set. In this sample set, i have 1000 variables either ‘0’ or ‘1’ from my testing behaviors. (1 means behavior happened, 0 means behavior does not exist.) For example, it, in this 1000 numbers, has 700 times that show 1. Thus, observed behaviors happened 70%. Then I used T-test to find significance of this 70%. Is it appropriated to use T-test for this purpose? What can my hypothesis be?
Thank you very much.
It doesn’t seem likely that you would want to use a one-sample t test in this situation. With just 0’s and 1’s the data is not normally distributed (one of the assumptions for the t test). If you let me know what hypothesis would you like to test, we can decide which test to use.
Charles
Hi Charles,
Thank you very much.
I have a set of alternatives in my data where each data has x-value and y-value. Then I would like to compare trade-off behavior between them. If a pairwise alternative has trade-off relationship then it will keep result as ‘1’ otherwise ‘0’. Thus, I would like to compare than if one pairwise shows 30% trade-off and another pairwise has 70%. Are they both significant in percentage? Like can we say that 30% is important as well as 70% possibility. Thus, 30% trade-off should be considered and be able to represent data also.
Dear Charles,
The lectures and answers were very helpful.
Just a final verification from someone with very little knowledge on stat.
One can use T-test to compare a sample mean to be significantly the same as that of the population mean when the population mean is unknown?How does one set the null hypothesis for this?
Thank you very much
The one sample t test is used when the population standard deviation (not the mean) is unknown. The t test tests whether the population mean has some specified value (often called the hypothetical mean). Examples 1 and 2 on the referenced webpage show how to set the null hypothesis for this test.
Charles
I have done some calculations based on your guidelines. Can you tell me how do say that whether my hypothesis for t value is accepted or rejected. Based on the power what should be my analysis. Thanks, Jay
Mean 3.330985915
Mode 4
Std Dev 1.372071122
Sample 142
size 0.241230874
tails 1
Hyp Mean 3
std error 0.115141651
df 141
t-stat 2.874597622
P value 0.002336352
alpha 0.05
Power
t-crit 1.655732288
x-crit 3.190643749
real mean 3.330985915
t -1.218865335
beta 0.887534708
Power 0.112465292
Jay,
Using the figures that you have written (I haven’t tried to verify them), I conclude:
Since p-value = 0.00234 < .05 = alpha, you reject the null hypothesis Power of 11.2% is quite low (assuming that the calculation is correct). You shoud consider using a larger sample. Charles
Dear Charles,
I am using t test for one sample. My sample size is 142. While going through your info, I find it difficult to arrive at alternate formula for t_dist that you have given. Can you help me in the following i) Is it correct to use t test – one sample for my study having sample size of 142 ii) How do I use Power for interpretation (final result). Please advise. Thanks. Jay
Jay,
I can’t find an alternative formula for t_dist on the referenced page. Perhaps I missed it. What are you referring to?
I believe that I have responded to the rest of your comment in my response of yesterday.
Charles
Dear charles.
thank you for the materials, but i still don’t understand something about the P value calculation why can we use T-Distri to calculate the P value please explain me more easily
Dear Traore,
You can use the t distribution to calculate the p-value via the function TDIST or T.DIST, as shown in Figure 1 of the referenced page.
Charles
Sir Charles,
is it correct to apply t-test to a mean of a Likert (1-7 score) responses?
I explain better, there is a set of responses with n=60 and for Q1 (i.e. n=1 Q1=2; n=2 Q1=1; n=3 Q1=7; n=i Q1=x; mean Q1=4.52), and I apply t-test to Q1 mean.
I’m interested to understand if Q1 result is reliable.
Thanks.
Stefano,
The one sample t test is used to determine whether the population mean has a value m based on data in your sample. I can’t tell from your example if this is what you are trying to test. You used the word “reliable”. Perhaps you are trying to test for reliability, in which case you might want to use Cronbach’s alpha: see the following webpage for more details: https://real-statistics.com/reliability/cronbachs-alpha/.
Charles