Basic Concepts
The Generalized Extreme Studentized Deviate (ESD) Test is a generalization of Grubbs’ Test and handles more than one outlier. All you need to do is provide an upper bound on the number of potential outliers.
We test the null hypothesis that the data has no outliers vs. the alternative hypothesis that there are at most k outliers (for some user-specified value of k).
To test the data set S with n elements is we generate k test statistics G1, G2, …, Gk where each Gj is a two-tailed Grubbs’ statistic, defined as follows:
S1 = S
x̄j is the mean of Sj and sj is the standard deviation of Sj
Sj+1 = Sj − {xj} where xj = the element in Sj such that |xj − x̄| is maximized
Essentially you run k separate Grubbs’ tests, testing whether Gj > Gj-crit where Gj-crit is Gcrit as described at Grubbs’ Test, but adjusted for the correct value of the sample size; i.e. n is replaced by n − j + 1. Now let r be the largest value of j ≤ k such that Gj > Gj-crit. Then we conclude there are r outliers, namely x1, …, xr. If r = 0 there are no outliers.
Note that if Gj > Gj-crit and h < j, then both xh and xj are outliers even if Gh ≤ Gh-crit.
Example
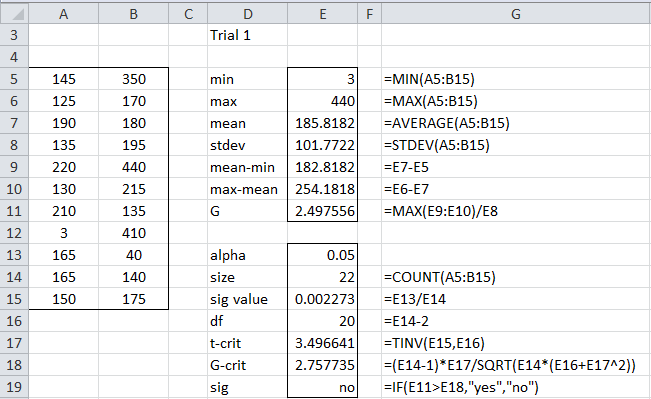
Example 1: Identify all the outliers in the data set shown in range A5:B15 of Figure 1.
Figure 1 – First trial of the ESD Test
Looking at the data set, we see five potential outliers: 3, 40, 350, 410, and 440. As we did in Grubbs’ Test we need to test for normality. In fact, if we were to run the Shapiro-Wilks test it would show that the data set without the five potential outliers is normally distributed. We, therefore, use the ESD Test with k = 5 (for five outliers); in fact, just to be sure we will set k = 6.
The Grubbs’ Test for the first outlier is shown on the right side of Figure 1. This is the two-tailed version of the test shown in Figure 2 of Grubbs’ Test. We see that the minimum data value is 3 (cell E5) and the maximum value is 440 (cell E6). We also see from cells E9 and E10 that the maximum value is farther away from the mean than the minimum value, and so our first test is to see whether 440 is an outlier.
Analysis
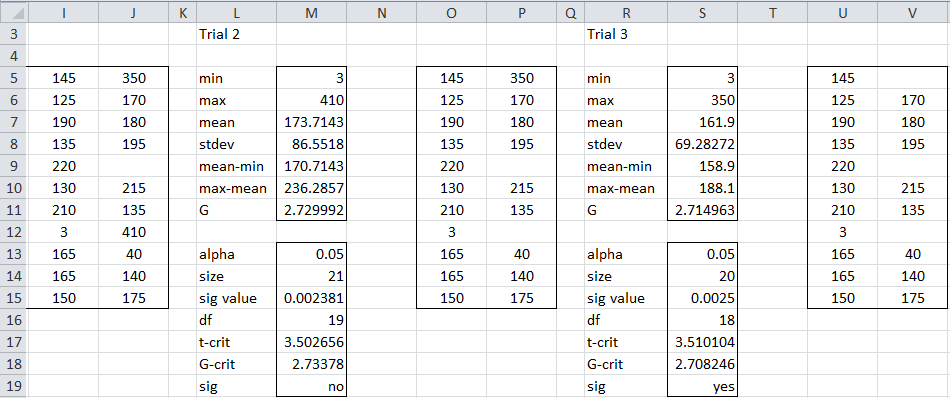
The test is not significant, but as we shall see, this doesn’t necessarily mean that 440 is not an outlier. We now run the test five more times. The next two trials are shown in Figure 2.
Figure 2 – Trials 2 and 3 of the ESD Test
The data set for the second trial (range I5:J15) is the same as for the first trial, but with the data element 440 removed. The second trial shows that once again the maximum value (410) is further away from the mean than the minimum value (3). This means that our second trial is a test as to whether 410 is an outlier. Once again the test is not significant.
Removing 410, we get the data for the third trial as shown in range O5:P15. Once again the maximum value (350) is further away from the mean than the minimum value (3), but this time the test is significant, which means that 350 is an outlier. But this automatically classifies 440 and 410 as outliers too.
Results Summary
We summarize the results of all six trials in Figure 3.
| Trial | outlier | G | G-crit | sig |
| 1 | 440 | 2.497556 | 2.757735 | no |
| 2 | 410 | 2.729992 | 2.73378 | no |
| 3 | 350 | 2.714963 | 2.708246 | yes |
| 4 | 3 | 2.721414 | 2.680931 | yes |
| 5 | 40 | 2.83852 | 2.651599 | yes |
| 6 | 220 | 1.707766 | 2.619964 | no |
Figure 3 – ESD Test Summary
Figure 3 confirms that 3, 40, 350, 410, and 440 are outliers (220 is not an outlier).
Worksheet Function
Real Statistics Function: The Real Statistics Resource Pack provides the following array function to perform the ESD test.
ESD(R1, lab, alpha, k): outputs a 4 × k column array with the following entries in each column: potential outlier, G, Gcrit, and test significance
If lab = TRUE (default FALSE) then the output is a 4 × (k+1) array with a column of labels appended. alpha = the significance level (default .05). The potential outlier is either the maximum or minimum value in R1, depending on which is farthest away from the mean of R1. The test significance is “yes” if G > Gcrit and “no” otherwise.
If k is omitted (or zero) and lab = FALSE then the value of k is set to the number of columns in the highlighted range, while if k is omitted (or zero) and lab = TRUE then the value of k is set to the number of columns in the highlighted range minus 1 (the extra column contains the labels).
For Example 1, if you highlight the range AN23:AT26, enter the formula =ESD(A5:A15,TRUE) and press Ctrl-Shft-Enter, then the output that appears is displayed in Figure 4.
Figure 4 – Output from ESD formula
Since the highlighted range contains 7 columns and lab = TRUE, k = 6.
Another Worksheet Function
Real Statistics Function: The Real Statistics Resource Pack also provides the following simpler array function to perform the ESD test.
OUTLIERS(R1, alpha, k): outputs a column array with up to k outliers from R1; if k is omitted (or zero) then the value of k is set to the number of rows in the highlighted range; alpha defaults to .05.
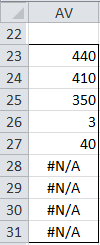
For Example 1, if you highlight the range AV23:AV31, enter the formula =OUTLIERS(A4:A14) and press Ctrl-Shft-Enter, then the output that appears is displayed in Figure 5.
Figure 5 – Output from OUTLIERS formula
Since the highlighted range contains 9 rows, k = 9. As you can see from Figure 5, even if we perform the ESD test with 9 trials, we still get the same five outliers.
Examples Workbook
Click here to download the Excel workbook with the examples described on this webpage.
References
Wikipedia (2014) Grubbs’s test
https://en.wikipedia.org/wiki/Grubbs%27s_test
Swarup, S. (2021) Anomaly detection with GESD (Generalized extreme studentized deviate) in Python
No longer available online


Hey,
is it possible to utilize this method for data which isn´t normally distributed?
Hi Elisa,
Yes, this test assumes that the data, excluding any outliers, are normally distributed.
Charles
Hi Charles,
If you were presenting data from this test, is there a p-value you could calculate? How would you report a “significant” outlier.
Thanks
Michael,
This test is generally conducted by comparing the test statistics with a critical value instead of using a p-value.
How to identify significant outliers is described on this webpage.
Charles
How are you determining alpha?
You can use any value you like for alpha. The value is typically set to .05.
Charles
Please skip the previous message. I think the data is showing no outliers.
Hi, Dr. Zaiontz;
Can you please run through my data? I can’t get it to converge.
11.6 10.2
11.2 7.8
9.8 14.3
9.6 13.4
16.7 12.0
10.3 7.7
15.4 14.2
15.3 10.9
13.5 8.0
9.9 7.2
9.1 4.0
8.0 6.7
14.1 3.4
10.0 8.6
15.8 9.7
23.1 22.2
Hello, I have a little doubt . In this paper by ASTM Standardization News, dated:2015
link:https://www.astm.org/standardization-news/images/nd15/nd15_datapoints.pdf
The process to calculate the outliers seem a bit different , if we go by their rule in the above example in figure3 , first 5 point would be outliers. I am little confused with the way we proceed. Can you please help me understand this a little better. The steps are as follows according to the mentioned paper:
GESD Procedure:
1. Decide a priori the maximum number of outliers
to test for. Let’s call this number r. (A general
recommendation is to set r = 20 percent of n.)
2. Set current cycle index i = 1.
3. Calculate the quantity T = | observation –
average| ÷ s for every member of the dataset in
the current cycle.
4. Identify the observation with the largest T.
Designate this as T1 max (i.e., maximum T for the
first cycle.)
5. Remove the observation identified in 4) from the
dataset.
6. Increase current cycle index i by 1 : i.e. i = i + 1
7. Repeat steps 3 to 6 using remaining data up to
and including i = r.
8. On completing step 7, beginning with Tr max,
maximum T value in cycle r, and working
backwards (Tr-1 max, Tr-2 max …. and so on), compare
this maximum value versus the critical value for
the specific cycle (λi
) obtained from the ASQC
publication.
9. Identify the highest cycle for which Ti max exceeds
its limit value. The observation associated with
the Ti max for that cycle and all observations
associated with the Ti max’s for all previous cycles
up to and including cycle 1 are considered to be
outliers.
Hello Ash,
The procedure described in the paper you referenced is the same as that used by the Real Statistics ESD function.
Charles
hi Dr Charles ,
thank you very much for your intuitive explanation,
i might be a bit confused but do we always consider all previous points automatically anomaly points if the current inspected point ‘s test proved that it’s an anomaly point ?
thank you.
If I understand your question correctly, this is done automatically for you.
Charles
Thank you for the site, it is an excellent and very helpful resource.
May I ask, possibly a daft question?
Taken from your first paragraph,
“Essentially you run k separate Grubbs’ tests, testing whether Gj > Gj-crit where Gj-crit is Gcrit as described above, but adjusted for the correct value of the sample size; i.e. n is replaced by n − j + 1”
Would you mind clarifying for me what j is here, why we minus it and add 1 on?
Thanks so much
Hello Kay,
First of all Gj-crit is defined at Grubbs’ Test.
Now to answer your question. The index j takes values from 1 to n. When j = 1, the value of n-j+1 = n, and so the sample size is n, the complete sample. When j = 2, the value of n-j+1 = n-1, which is the entire sample minus the one outlier you have potentially already found. When j = 2, then n-j+1 = n-2, which is the complete sample minus potentially two outliers already found. Etc.
Charles
That’s great, thanks.
May I also check that when dealing with a large population size (worthy of Grubb’s ESD method) the way to calculate G-crit?
To calculate G-crit would we use the Tcrit described on this page or the Tcrit used in the Grubbs esd method? Formatted in Excel, do we take Tcrit to be T.inv(1- significance value, degree of freedom) or Tinv(significance value, degrees of freedom)?
Thanks again,
Hi Kay,
For ESD you need to perform a two-tailed test and so you use T.INV.2T (or equivalently TINV), For Grubbs test you have a choice of using the one-tailed (T.INV) or two tailed test (T.INV.2T).
Charles
Hi, Dr. Charles,
Its possible use the ESD in bivariate outliers?
Hello Gonzalo,
I don’t know a bivariate version of ESD, but the following two webpages describes how to detect multivariate outliers:
https://real-statistics.com/multivariate-statistics/multivariate-analysis-of-variance-manova/manova-assumptions/
https://real-statistics.com/real-statistics-environment/real-statistics-multivariate-functions/ (see MOUTLIERS function)
Charles
My first post here. Congrats for the very interesting site!
I would use this test and the Shapiro-Wilks test as one-tailed tests (the values cannot be lower than zero, but can go to +inf). Should I do some modifications?
Cristiano,
There is a one-sided version of Grubbs test (ESD restricted to one outlier), but I don’t know of a one-sided version of the ESD test.
That values can’t go lower than zero does’t mean that a one-sided test is appropriate. E.g. if I generate a sample with 50 elements by using the formula =NORM.S.INV(RAND())+10.0, then probably none of the elements will be below zero, yet the sample is clearly drawn from a normal distribution with mean 10.0. A two sided test is required since there is symmetry around 10. The situation would be different if the data were distributed based only on the right side of a normal distribution.
Charles
Hi Charles,
You’re perfectly right, I said that badly.
The values are the distance between two points in a 3D space, so I think that a one-sided test should be appropriate. Unfortunately, the distribution is unknown and far from normal (it vaguely resemble a very long-tailed log-normal distribution).
Currently, the best I can do is to say that a value is an outlier if value – mean > 10 sigma (based on the Chebyshev’s inequality).
Is there any tool in your Resource Pack that I could use?
Cristiano,
If the distribution were log-normal, then you could perform a transformation and then use the outlier tests for the normal distribution.
Since it doesn’t follow a clear distribution, the resource pack doesn’t contain the tool that you are looking for.
Charles
Hi Charles,
In the formulas for ESD and Outliers, how do you set k? It would appear that it would automatically provide a list of the outliers based on the number of rows selected but I only ever get 1 outlier when I try it against my data sets and I can clearly see at least 2.
Caroline,
you just need to use your judgement as to a reasonable value for k.
Charles
Hi Chuck, Thank you for the clear definition and great example.
In the text above Figure 1 for Example 2:
“Identify all the outliers in the data set shown in range A18:B28 of Figure 1”
Do you mean “in range A5:B15 of Figure 1” or am I missing something?
Hi Jesse,
Yes, you are correct. Thanks for finding this mistake. I have corrected the error on the webpage.
I really appreciate your help in making the website better and easier to use.
Charles
What is the smallest number of values for which this statistical approach is valid? I tend to have only 5 or 6 data points, which ESD makes all outliers until I get down to 2 points which obviously stops working. Is there a method for such a small sample?
Sue,
Most statistical methods don’t really work that well with such small samples (5 or 6 data points), unless that values are really extreme. E.g. with data such as 2, 3, 6, 8, 400, it is pretty easy to see that 400 is an outlier, but not so clear with 2, 3, 6, 8, 15.
Charles
Should the ESD and OUTLIER functions give the same answer? I am finding that when I have a smaller set of data (n=14) sometimes OUTLIER returns all the values as being outliers, whereas running ESD gives what appears to be the real couple of outliers.
Tom,
They won’t necessarily give the same answers.
Charles
Is there a way to determine which one would be more correct to use in a given situation?
There isn’t even a clear definition of what is an outlier. Is it related to IQR units from the median or standard deviations from the mean? Is an outlier a naturally occurring thing: e.g. in a sample of 10 perhaps I should consider a data element that is 3 standard deviations from the mean to be an outlier, but should I do the same in a sample of 10,000? In general, I would use both tests to discover potential outliers and then evaluate each to determine whether or not I should do something special with that data element
Charles
Along the lines of the first comment, how is the value for k determined, or even estimated? If running repeated Shapiro-Wilk tests for normality, removing one value at a time, doesn’t this itself give you the number of outliers, without the need for the ESD?
Rick,
One way to estimate k is to plot the data.
You don’t necessarily need to use ESD to find the outliers, but it can be helpful in doing so.
Charles
Hi Charles , Thanks for the fantastic contents.
But just one question: why not just do the test from the k+1 to 1?
Yvette,
I am not completely sure that I understand what you are suggesting, but he problem is that you don’t really know the correct value of k to use.
Charles
Excellent site, thanks.
Just above Figure 4, you have “=ESD(A4:A14,TRUE)”. I think this should be: “=ESD(A5:B15,TRUE)” to be consistent with Example 2 on this page.
Alec,
Thanks for catching this mistake. I have just made your suggested change on the webpage.
Charles
It appears you are doing a 2-sided test, since you are looking at both minimum and maximum deviation from the mean. As such, shouldn’t the cell E17 in Figure 1 be defined as TINV(E15/2,E16), rather than TINV(E15,E16)?
Bob,
In Excel TINV is already the two-tailed inverse.
Charles