In Confidence Interval for Effect Size and Power, we show how to calculate a confidence interval for statistical power of a t test based on a confidence interval for the noncentrality parameter. On this webpage we show how to use Real Statistics functions to quickly calculate such confidence intervals.
Worksheet Functions
Real Statistics Functions: The following array functions are provided in the Real Statistics Resource Pack:
T1_POWER_Conf(d, n, tails, lab, alpha, iter, prec) = a column array containing the power of a single sample t test, plus the lower and upper confidence interval limits of the power, where if lab = TRUE (default FALSE) then a column of labels is appended to the output and all the other arguments are as for the T1_POWER function (see Statistical Power of the t Tests).
T2_POWER_Conf(d, n1, n2, tails, lab, alpha, iter, prec) = a column array containing the power of a two independent sample t test, plus the lower and upper confidence interval limits of the power, where if lab = TRUE (default FALSE) then a column of labels is appended to the output and all the other arguments are as for the T2_POWER function (see Statistical Power of the t Tests).
Examples
Referring to Figure 5 of Confidence Interval for Effect Size and Power, the output from =T1_POWER_Conf(AA9, AA7,2,TRUE) is similar to that shown in range Z13:AA15 of that webpage.
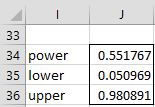
Referring to Figure 2 of Confidence Interval Functions for Effect Size d, the output from =T2_POWER_Conf(J12,J7,J8,2,TRUE) is shown in Figure 1. Thus, although the power is 55.2% (based on the sample), you are 95% confident that the actual power (for the population) is between 5.1% and 98.1%.
Figure 1 – 95% confidence interval for power
References
Howell (2010) Confidence intervals on effect size
https://www.uvm.edu/~statdhtx/methods8/Supplements/MISC/Confidence%20Intervals%20on%20Effect%20Size.pdf
Lecoutre B., (2007) Another look at the confidence intervals for the noncentral t distribution
https://digitalcommons.wayne.edu/jmasm/vol6/iss1/11/
Steiger, J. H., Fouladi, R. T. (1997) Noncentrality interval estimation and the evaluation of statistical models
https://statpower.net/Steiger%20Biblio/Steiger&Fouladi97.PDF
