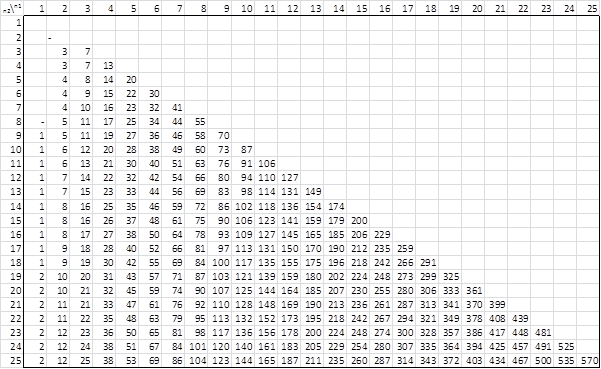
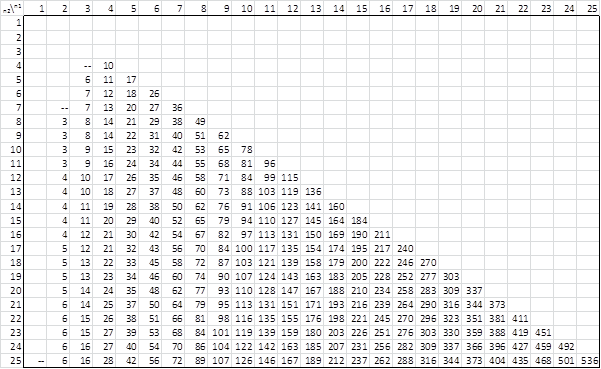
In the following tables, n1 is the size of the smaller sample and n2 is the size of the larger sample. See Wilcoxon Rank-Sum Test for details. Note that α for a one-tail test (lower tail) is equivalent to 2α for a two-tail test.
Alpha = .01 (two-tailed)
Alpha = .05 (two-tailed)
Alpha = .20 (two-tailed)

Observation
A more detailed list of critical values can be deduced from the Mann-Whitney table or the reference listed below.
Download Table
Click here to download the Excel workbook with the above table.
References
Lindqvist, B. H. (2010) Wilcoxon tables
https://folk.ntnu.no/bo/TMA4255/2010v/Foils2010/Wilcoxon-tables.pdf
Elte University (2016) Table of critical values for the Wilcoxon rank-sum test
http://plantsys.elte.hu/oktatas/Biometria/tablazatok/Wilcoxon_table_ketmintas_probahoz.pdf
Howell, D. C. (2010) Statistical methods for psychology (7th ed.). Wadsworth, Cengage Learning.
https://books.google.it/books?hl=en&lr=&id=CRYKAAAAQBAJ&oi=fnd&pg=PR5&dq=Howell,+D.+C.+(2010)+Statistical+methods+for+psychology+(7th+ed.).+Wadsworth,+Cengage+Learning.&ots=awaJI8z2vX&sig=09KIr6AuKAfgelOMH8V4eoMahfs


IN rank sum method how to find table value for single sample
You don’t use the rank-sum test for a single sample. You use the Wilcoxon signed ranks test instead. See
https://www.real-statistics.com/wilcoxon-signed-ranks-test/
Charles
What about when alpha is 0.1?
Bobby,
The Wilcoxon Rank-Sum Test is equivalent to the Mann-Whitney, and so you can use the Mann-Whitney Table instead of the Wilcoxon Rank-Sum Table since it contains values for alpha = .1 (as well as a wider range of alpha values). You can find this table at:
https://www.real-statistics.com/statistics-tables/mann-whitney-table/
The rule is quite simple if k is the value on the Mann-Whitney Table, then the critical value for the Wilcoxon Rank-Sum test is k+m(m+1)=2 where m is the smaller of the two samples sizes. E.g. for alpha = .05 and n1 = 10 and n2 = 12, the critical value on the Mann-Whitney Table is 29. You need to add 10(10+1)/2 = 55 to this value to get 84, which matches the value on the Wilcoxon Rank-Sum Table.
You can also get the same value by using the Real Statistics MWINV function.
Charles
hello how do i read the table of wilcoxon rank sum test when i am not given n1 and n2? i just only have n and m
n2 is the larger of m and n. n1 is the smaller of m and n.
Charles
Hi Charles,
Do you have an idea how the values of this table are calculated? Is there an algorithm somewhere?
In “An introduction to Mathematical Statistics and its applications” 3rd edition; they describe a similar but simpler test where we compare the median of a single sample to a given value. There you have to compute the sum of the ranks that are above the supposed median. They show this follows a law where P(X = w)= (1/2^n)*c(w) where c(w) is the coefficient of e^{wt} in \prod_{i=1}^n (1+e^{it}). It is relatively easy to devise a recursive algorithm that computes this.
It seems that something similar must exist in the case where we compare two medians from two independent samples. But I am unsure…
Hello Olivier,
The table can be based on the Wilcoxon Rank-Sum Exact Test. See
Wilcoxon Rank-Sum Exact Test
Charles
hello sir,
i have to compare 2 groupes of students n1= 5 n2=5
the result is the folowing:
p value 0.73
u: 14.5
how can i reject or accept the H0?
thank you
With a p-value this high you would generally not reject the H0.
Charles
If I have a sample size of 9 and 18 can I still use the ‘=NORM.DIST(A1,A6, B8, TRUE) function described for calculating P values for larger sample sizes?
Chrissy,
The normal approximation is probably ok, but it is marginal. I wouldn’t be surprised that the result is more or less the same with that using the table of critical values.
Charles
Thanks very much for your comment, also your whole webpage has helped me no end so thanks very much, it’s a brilliant resource!
When I used the NORM.DIST function my W’ value was larger than W (so I actually used 1- NORM.DIST…) and Wcrit value was more or less the same as my W’ value, rather than W. Presumably this is okay?
Many thanks
Chrissy,
I am pleased that I have been able to help you.
Probably this is ok, but I’d have to see the details to say for sure.
Charles
Hello Sir,
My n1 and n2 are 50. I dont know how to find value corresponding to these values in table.
Please help me.
Navdeep,
For values above 20, you don’t need to use the table. Instead you should use the normal approximation as described on the website.
Charles
Hi Charlez,
I am little confused, why the result of table is different from table in page 1097 in this link: http://www.stat.ufl.edu/~athienit/Tables/tables.pdf
Hi Sadegh,
There is some fluctuation between statistical tables from different sources. I checked the TL values at alpha = .05, two-tails, for n2 = 10. The values in the table in the site you referenced are generally 1 unit higher than in the table on my site. I don’t know why the two sources got different values. The values on my site appear in many references, including Howell’s textbook, Statistical Methods for Psychology.
Charles
Thanks for reply. I will take a look at Howell’s textbook.
good luck!