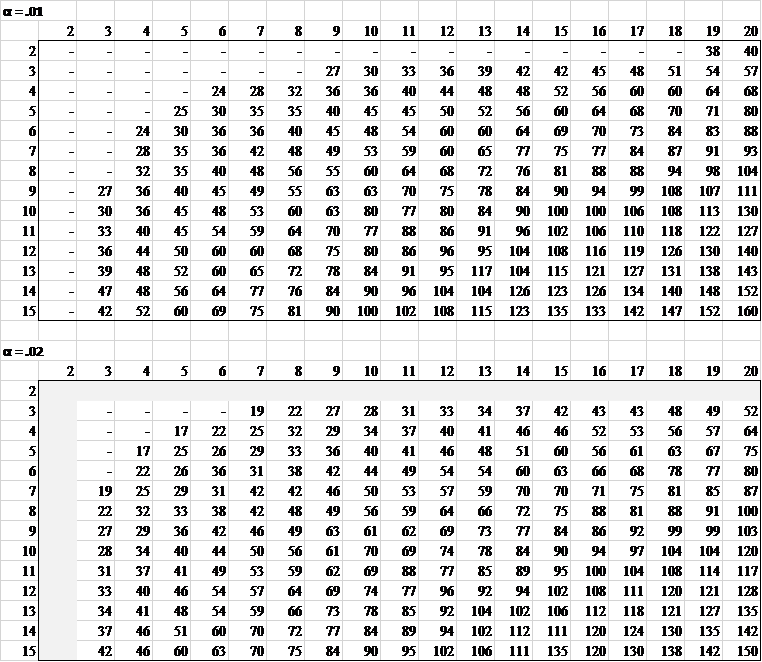
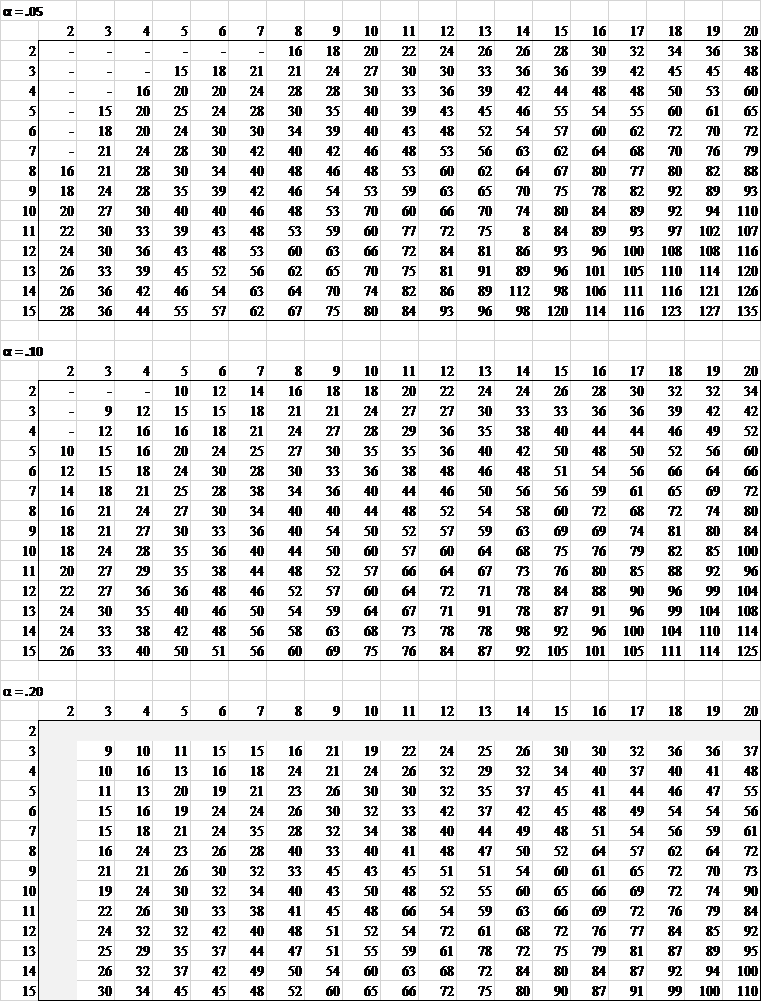
The table specifies the critical values Dm,n,α for the two-sample version of the KS test as described in Two-Sample Kolmogorov-Smirnov Test. Each critical value Dm,n,α is equal to the value in the table divided by mn. E.g. D10,15,.01 = 100/(10·15) = .66667.
Download Table
Click here to download the Excel workbook with the above table.
Reference
Wessel, P. (2014) Critical values for the two-sample Kolmogorov-Smirnov test (2-sided), University Hawaii at Manoa (SOEST)
https://www.webdepot.umontreal.ca/Usagers/angers/MonDepotPublic/STT3500H10/Critical_KS.pdf


Dear Charles my samples are both 33 observations. my significance value is 0,05. how can I reach the D value?
Hello Filipa,
The samples are too large for the table. Instead, use the approach described at:
https://real-statistics.com/non-parametric-tests/goodness-of-fit-tests/two-sample-kolmogorov-smirnov-test/
Charles
I want to know that , whether the table given here is for one tailed test or two tailed test.
Two-tailed
Charles
Thanks a lot for this table, but do you happen to know how can I extend it? This is because one of my samples is 17, but the other one is close to 3000, also I would like to be able to calculate values for a larger significance (I would rather to actually calculate the p value corresponding to the statistic that I got).
Thanks for your help.
Hi Ruben,
You can use the values from the KSINV function as defined on the following webpage:
https://real-statistics.com/non-parametric-tests/goodness-of-fit-tests/two-sample-kolmogorov-smirnov-test/
Charles
Dear Dr.Charles Zaiontz,
First of all, thank you so much for helping out researchers in K-S test as there are no clear informational videos on YouTube.
As per your instructions, I did 2 sample K-S test and found out the D-Stat values. But installing real stat package for additional macros didn’t work out and the 2 sample K-S table is also limited.
Kindly help me out in finding D-Critical and p-values for the same using 2 sample K-S test macros. Thanking you sir.
First Sample:
Alpha Value = 0.05
D-Stat = 0.120170455
Size 1 = 64
Size 2 = 55
Second Sample:
Alpha Value = 0.05
D-Stat = 0.15496368
Size 1 = 59
Size 2= 42
Third Sample:
Alpha Value = 0.05
D-Stat = 0.045092616
Size 1= 123
Size 2= 97
1. Why didn’t installation of the Real Statistics software not work out?
2. The p-value for the three samples are .79, .60 and .99 (actually just short of 1).
Dear Dr.Charles Zaiontz,
Thank you for your reply.
I am trying to install again in excel 2003 and will get back to you if the problem continues. I also tried the same test in SPSS and got the p-values of what you mentioned but was not confident enough as all 3 sample shows non-significance. I will once gain install it from scratch and check it.
Thanking you.
If my m is 6 and n is 9 and significance level is 0.05 then what is the critical value of [K-S] test?
Reply
45/(6×9) = 45/54 = .8333
Charles
But in book answer is 2/3=0.66
.66 is an approximation for 2/3. The real value is .6666666666666666666666 (with an infinite number of 6’s)
Charles
How about if my m is 44 and n is 36?
Ephy,
The table doesn’t support these values, but you can get an approximate value at
https://real-statistics.com/non-parametric-tests/goodness-of-fit-tests/two-sample-kolmogorov-smirnov-test/
Charles
Thanks for this. On your website I have found 3 different routes to calculating the critical D for a 2 sample KS test. Each of them produces a slightly different answer.
I happen to have 2 samples of data, one with 19 values, one with 6. I want to calculate the critical D at the 0.05 probability level. So,
1) Using the 2 sample table above I find that using m=19 and n=6 gives me 70. Dividing this by m*n gives 70/(19*6) = 0.614
2) Using your KSINV function, we have KSINV(0.05, 19, 6) = 0.589
3) Using the approximation for large samples where D(m,n,α) = KINV(α)*SQRT((m+n)/(m*n)), we get 1.358*sqrt(19+6/(19*6)) = 0.636
Can you explain why they differ? Which is the best one to use?
Joe,
Since the smaller sample is 6, which is not a particular large sample, I would tend to have less confidence in the large sample approximation. Between the other two values, I would tend to use the value found in the table. If the values 6, 19, .05 were not found in the table, I would probably recommend the value produced by KSINV.
Each of these values is based on different assumptions, and so it is not surprising that there would be differences. This sort of issue is fairly common in statistical analysis.
Charles
Hi, Can you share what is the source of the numbers in the tables? Conover(1999) has slightly different values from what I could see.
Thanks a lot!
Eugen,
I was pretty sure that there is a reference to this table in the Bibliography, but now I can’t find it. I will eventually find it, but I wanted to respond to you before too much time went by.
In any case, how much different are the values in Conover’s table?
Charles
Please let me know what will happen in case of large number of sample sizes??
Saheli,
This is explained at https://real-statistics.com/non-parametric-tests/goodness-of-fit-tests/two-sample-kolmogorov-smirnov-test/
Charles
I don’t understand how this table is expressed – I understood the critical values in a two-sample KS test to be (for alpha=0.05, for example):
1.36 * root ( (n1+n2)/n1*n2 )
Shouldn’t the critical values be fractions?
Shouldn’t they get smaller with larger sample sizes?
Statto,
Good question. I had forgotten that I included this table. You are correct that the values don’t seem to be consistent with the values you would expect for critical values. I am pretty sure that the values listed need to be multiplied or divided by some formula. In any case, after I added the KSINV function, there was no need for the table. The critical values can be approximated using KSINV(n1, n2, alpha).
I will try to investigate the table further, but if I can’t find my notes on this, then I will remove the table from the website.
Charles
Statto,
I have finally recalled how to interpret the table. I have now included this explanation at the beginning of this webpage.
Charles
Hello Charles,
Thanks for the nice teaching of Kolmogorov-Smirnov test.
I am comparing two gamma distributions, each containing 1451 data and I know the rate and scale parameters.
1. I know that the two distributions are not the same I need to show for example the 50 percentile of the data in one distribution will fall into the other distribution with what Confidence Interval. How can I calculate that?
Would you please help me on that?
And unfortunately KSINV function does not exist in my excel.
Many thanks,
Reza
Reza,
Sorry, but I don’t understand your question.
Charles