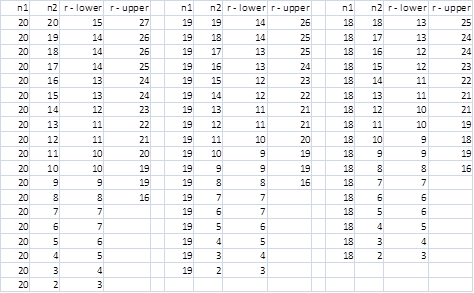
The ranges listed for r contain the lower and upper values for which the null hypothesis (that the runs are random) is not rejected at the 5% level (two-tailed test). See One Sample Runs Test for details.
Download Table
Click here to download the Excel workbook with the above table.
References
Zar. J. H. (2010) Biostatistical analysis 5th Ed. Pearson
Kanji, G. K. (2006) 100 Statistical tests. 3rd Ed. SAGE
https://methods.sagepub.com/book/mono/100-statistical-tests/toc


hello
Hi Charles, may I ask if there’s any way to download this table of critical values of test of randomness into my Excel?
Thank you very much.
Hi Wat Chi Ming,
I have just added a link to this webpage. If you click on this link an Excel version of the table will be downloaded to your computer.
Charles
Hi Charles, thank you very much. In case you’re free, would you mind pointing me to the exact way of coming up with this table for small samples. I guess it’s an issue of combinations, right?
Again, thank you very much.
Hi, Wat Chi Ming.
I don’t know for sure, but the table was likely constructed using an exact (permutation) test. This is explained at
https://www.real-statistics.com/non-parametric-tests/one-sample-runs-test/runs-distribution/
Charles
how to determine if i have n1= 29 and n2= 31
See One Sample Runs Test
Charles
Use parametric, the table is for small sample size for n20 large sample use z test (x-u)/ó
Hi. What do the r-uppers with no value mean?
For instance I got m = 5 and n = 15, so Rl must be 4, but what should Ru be? Infinity? Many thanks.
Yes, infinity.
Charles
Hi, I’m curious about this outcome: n1=23, n2=1, r=2. Would this be significant?
Hi Rich,
The probability of this happening is 2/23 (n2 occurs in the first or last position).
Charles
Somehow my inequalities in the second paragraph were lost. Perhaps they were misinterpreted as an errant HTML tag. That would be humorous.
Charles,
I think your table is far more usable than the tables I’ve found precisely because you list the range of runs for which we cannot reject randomness. My original question has to do with the boundary between rejecting the null hypothesis and not rejecting it.
The tables I have seen do not report a range of runs. They report the probability that the number of runs is <= u given n1 and n2. Taking your example, with n1=n2=10, the reported probability is 0.019 for u=6, 0.051 for u=7, and 0.128 for u=8. At the high end, the probability is 0.949 for u=14 and 0.981 for u=15. I read this as meaning that to reject the null hypothesis at the 5% level u must be =15 or, conversely, that any number of runs from 7 to 14 inclusive is consistent with randomness. In other words, to find the entries for your table I am thinking I should find the first u whose probability is >0.05 and the last u whose probability is <0.95?
For this instance of n1 and n2 (10,10), your table says r-lower = 7 and r-upper =15, whereas I would say r-lower = 7 and r-upper = 14. Similarly, for my original question: n1=n2=5, the probability of 4 or fewer runs is 0.167, but the probability of 3 or fewer is 0.040, so I concluded that if I observe 4 runs I'd not be able to reject the null hypothesis, but if only 3 runs are observed I would be able to reject the null hypothesis. But 3 is r-lower in your table so I should not reject the null hypothesis.
Thanks for your patience with this level of detail.
Robert,
In a day or two I will place a new version of the table on the website. This version will contain entries for a range of values of alpha (not just alpha = .05). Please let me know whether this version of the table works better for you.
Charles
Charles,
Continued search led me to:
Eisenhart and Swed, Annals of Mathematical Statistics 14: 66, 1943.
Their table appears identical to the famous Table 10 from Wackerly, Mendenhall, and Scheaffer.
And if I read them correctly, they both think r-lower for n1=5, n2 =5 should be 4, rather than 3. Is your value based on newer theory?
Robert,
I have not generated the table from scratch, but merely used the standard table. I believe that the table I used and the ones you refer to are probably the same. Let me give you an example.
In the table on my site I show the interval 7, 15 for n1 = 10 and n2 = 10. You will probably find the values 6,11 on the table that you are referring to. On my table the interval [7, 15] is the range for which r (i.e. # of runs observed ) is not significant. The range 6, 11 means that if r <= 6 or r >= 11 then there is a significant result. These are equivalent ways of looking at the data.
Shortly I plan to augment the table on my site with data for values of alpha not equal to .05.
Charles