Example
Example 1: Find the 90% tolerance interval for a sample of size 40 with mean 10 and standard deviation .2 from a normal distribution with 99% confidence.
Two-sided interval
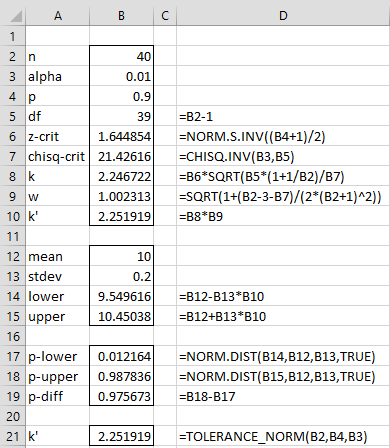
The two-sided interval is (9.5496, 10.4504), as described in Figure 1.
Figure 1 – Tolerance Interval (two-sided)
To obtain this result, we first calculate k′ as shown in cell B10 or B21. This result only uses the values for n, p and α. The tolerance interval is then calculated, as shown in cells B14 and B15, using k′ and the mean and standard deviation.
Note that the tolerance interval accounts for 97.57% of the normal distribution, as shown in cell B19.
One-sided interval
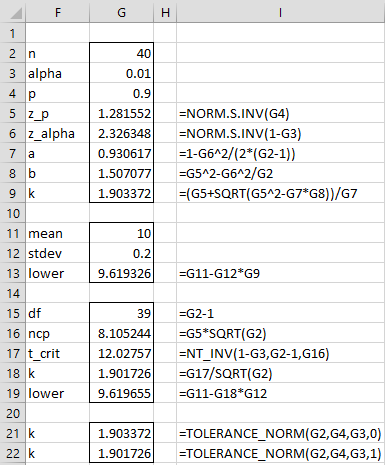
The calculation of the one-sided tolerance interval is shown in Figure 2.
Figure 2 – Tolerance Interval (one-sided)
k = 1.9034 (cell G9 or G21) using the Natrella approach, and so the right-sided 90% tolerance interval is (9.6193, ∞). Here 9.6193 = 10 – 0.2 ∙ 1.9034. The left-sided tolerance interval would be (-∞, 10.3917) since 10 + 0.2 ∙ 1.9034 = 10.3917.
k = 1.9017 (cell G18 or G22) using the noncentral t distribution. The right-sided tolerance interval is therefore (9.6197, ∞).
Examples Workbook
Click here to download the Excel workbook with the examples described on this webpage.
References
NCSS (2019) Tolerance intervals for normal data
https://www.ncss.com/wp-content/themes/ncss/pdf/Procedures/PASS/Tolerance_Intervals_for_Normal_Data.pdf
NCSS (2019) Tolerance intervals for any data (nonparametric)
https://www.ncss.com/wp-content/themes/ncss/pdf/Procedures/PASS/Tolerance_Intervals_for_Any_Data-Nonparametric.pdf
NIST (2019) Tolerance intervals for a normal distribution
https://www.itl.nist.gov/div898/handbook/prc/section2/prc263.htm#cases
Young, D. S. (2010) tolerance: An R package for estimating tolerance intervals
https://www.jstatsoft.org/v36/i05/

