Worksheet Functions
We now show how to build a Rasch model using Real Statistics capabilities.
Real Statistics Functions: The Real Statistics Resource Pack contains the following functions:
RASCH(R1, head, iter, prec): returns output similar to that shown in Figure 5 of Building a Rasch Model based on the data in R1, which is formatted as in range A4:K23 of Figure 1 on that webpage when head = TRUE or range B5:K23 when head = FALSE (default).
RASCHFIT(R1, head, iter, prec): returns output similar to that shown in Figure 6 of Building a Rasch Model based on the data in R1, which is formatted as in range A4:K23 of Figure 1 on that webpage when head = TRUE or range B5:K23 when head = FALSE (default).
iter = the maximum number of iterations. When the sum of the squares of the row residuals is less than prec (default .00001) then the iterations stop prior to iter.
In addition to the output as shown in Figures 5 and 6 of Building a Rasch Model, the output from these functions also includes the number of iterations actually made and the sum of the squares of the row residuals at that point.
Data Analysis Tool
Real Statistics Data Analysis Tool: We can use Real Statistics’ Item Analysis data analysis tool to create a Rasch model.
To use this data analysis tool for Example 1 of Building a Rasch Model, start by pressing Ctrl-m. Next, select Rasch Item Response Analysis from the Corr tab. If using the original user interface, select Reliability and then choose the Rasch Item Response Analysis option. Next, fill in the dialog box that appears as shown in Figure 1 and click on the OK button.
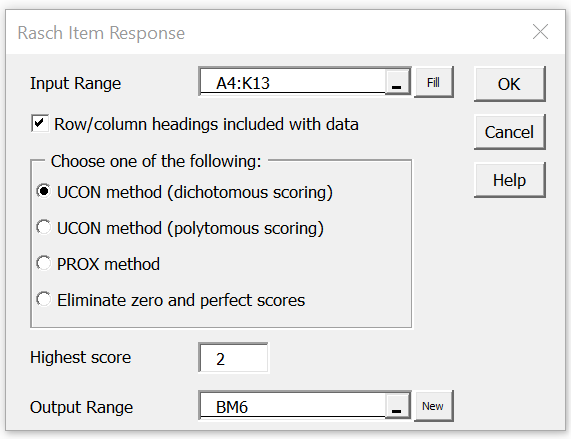
Figure 1 – Rasch Item Response dialog box
The output is shown in Figure 2. The default values for # of iterations, precision and cutoff are shown in the figure. You can change any of these values, in which case the Rasch model will change accordingly.
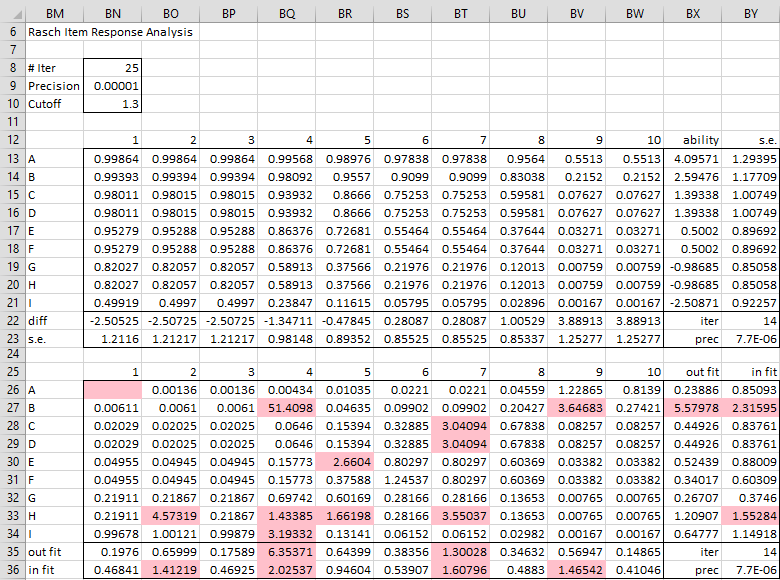
Figure 2 – Rasch Item Response output
Filling out the Table
If you know the values of the ability and difference parameters, you can also calculate the values of all the other cells in Figure 2.
For Example 1 of Building a Rasch Model, suppose we already know the ability and difficulty parameters, as shown in columns N and S of Figure 3.
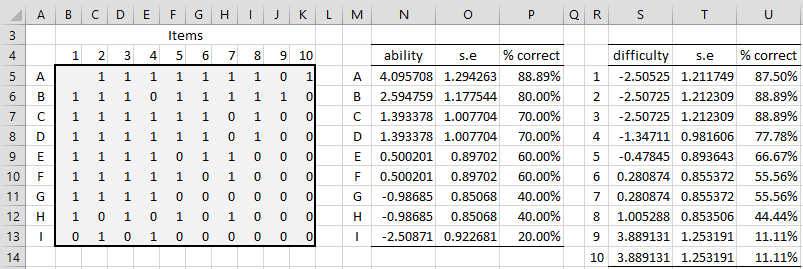
Figure 3 – Rasch ability and difficulty parameters
We can then calculate the other values as shown in Figure 4.
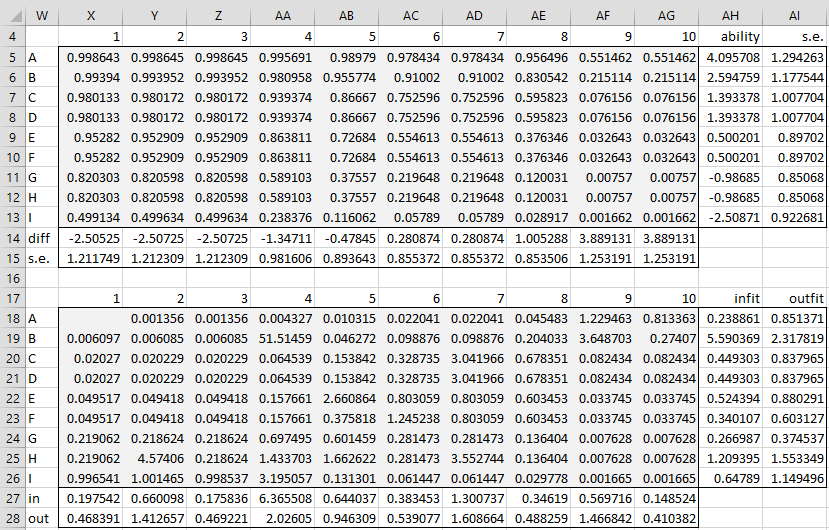
Figure 4 – Rasch analysis
Values in range AH5:AH13 and X14:AG15 are taken from N5:N13 and S5:S14 of Figure 3. The formula =EXP($AH5-X$14)/(1+EXP($AH5-X$14)) is used to calculate the value in X5. The array formula =1/SQRT(SUM(X5:AG5*(1-X5:AG5))) is used to calculate the values in AI5.
Cell X18 is calculated by the formula =IF(ISNUMBER(B5),(B5-X5)^2/(X5*(1-X5)),””). The formula =AVERAGE(X18:AG18) calculates the value in cell AH18. The array formula =SUMSQ(IF(B5:K5<>””,B5:K5-X5:AG5,0))/SUM(X5:AG5*(1-X5:AG5)) calculates the value in cell AI18. All the other cells are calculated in a similar manner.
Note that the values in Figure 4 are similar to those in Figure 2, although not exactly the same. If the precision in the iteration used to obtain the values in Figure 2 (or Figure 3) were zero, then the values in the two figures would be the same.
More Worksheet Functions
Real Statistics Functions: The Real Statistics Resource Pack contains the following functions. Here, R1 is a range containing the data without headings (as for range B5:K13 of Figure 3). R2 is a range with two columns containing the subject labels along with the corresponding ability values (as for range M5:N13). R3 is a range with two columns containing the item labels along with the corresponding difficulty values (as for range S5:T14).
RASCH_EXP(R1, R2, R3): returns an array with the expectation values (as for range W4:AI15 of Figure 4).
RASCH_FIT(R1, R2, R3): returns an array with the fit values (as for range W17:AI28 of Figure 4).
In addition, the Real Statistics Resource Pack provides the following two array functions.
RASCH_SUBJ(R1, head): returns an array with three columns consisting of the subject labels, and corresponding ability parameters and standard errors based on the data in R1; if head = TRUE (default) then R1 contains row/column headings
RASCH_ITEM(R1, head): returns an array with three columns consisting of the item labels, and corresponding difficulty parameters and standard errors based on the data in R1; if head = TRUE (default) then R1 contains row/column headings
For example, range M5:O13 of Figure 2 can be calculated by =RASCH_SUBJ(A4:K13, TRUE) and range R5:T14 can be calculated by the array formula =RASCH_ITEM(A4:K13, TRUE).
Eliminating Zero and Perfect Scores
As noted in Building a Rasch Model, before starting the analysis you must remove any subject who answered all items correctly or incorrectly as well as any item that everyone or no one answered correctly. Note too that after removing such subjects/items, additional subjects/items may now qualify for elimination, and so this can be an iterative process. The Real Statistics functions and data analysis tool described above assumes that this has already been done.
This can also be done for you by selecting the Eliminate zero and perfect scores option on the dialog box shown in Figure 1. You can then use this output as the Input Range for the Rasch Item Response Analysis data analysis tool. Thus you need to run the Rasch Item Response Analysis data analysis tool twice, first to eliminate any subjects or items with a zero or perfect score and then again to perform the Rasch analysis,
The data analysis tool calls the following Real Statistics function to eliminate the appropriate rows and columns. It is assumed that the input has row (subject) and column (item) headings.
Function to Eliminate Zero and Perfect Scores
Real Statistics Function: The Real Statistics Resource Pack contains the following function:
RASCH_INIT(R1): returns output similar to that in R1, but with all items and subjects with all or no correct answers eliminated; assumes R1 has row and column headings
For the dichotomous UCON method, we assume that all the scores are 0 or 1 (which is why we used the default value of 1 for the Highest score field in Figure 1, but even when higher scores are used (see below) then RASCH_INIT eliminates any row or column all of whose non-blank entries are 0 or this highest score value.
For example, referring to Figure 5, if we insert the array formula =RASCH_INIT(A4:K13) in the range M4:W13, we get the result shown on the right side of the figure.
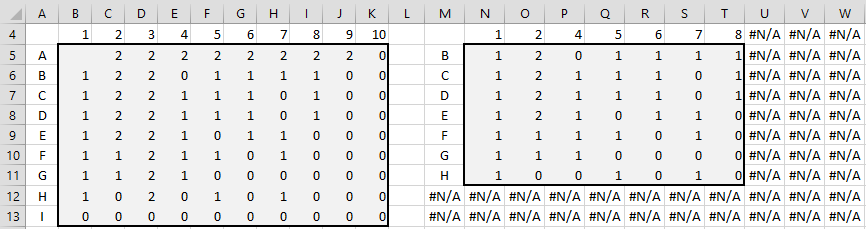
Figure 5 – Elimination of zero and perfect scores
Since the acceptable scores are 0, 1 and 2, we eliminate item 10 (column K) and subject I (row 13) since there are no correct responses. Once we eliminate these, item 3 (column D) and subject A (row 5) need to be eliminated since these now only contain correct responses (i.e. the values are 2’s). We also need to eliminate item 9 (item J) since there are now no correct responses.
We can now insert the range M4:T11 in the Input Range field of Figure 1, also setting the Highest score to 2.
Polytomous Data
On this webpage, we described the UCON method for dichotomous data. For the polytomous case, see Real Statistics Support for Polytomous Data or Real Statistics Support for PROX Model.
Examples Workbook
Click here to download the Excel workbook with the examples described on this webpage.
References
Wright, B. D. and Stone, M. H. (1979) Best test design. MESA Press: Chicago, IL
https://research.acer.edu.au/measurement/1/
Wright, B. D. and Masters, J. N. (1982) Rating scale analysis. MESA Press: Chicago, IL
https://research.acer.edu.au/measurement/2/
Wright, B. and Stone, M. (1999) Measurement essentials, 2nd ed.
https://www.rasch.org/measess/
Many thx for the real-statistics add-ins.
I input data without row and column names, so I did not check the option of row/column headings included.
The output added rownames and colnames for identification. However, the horizontal cells (ie colnames) were: sub1, sub2, sub3…, while the vertical cells (ie rownames) were item1, item2, item3…
As the columns were difficulty, should it be “item”; the rows were ability, should it be “sub”? Or have I misunderstood anything?
Thanks again.
Hello Josephine,
Thank you for bringing this error to my attention.
I will fix it in the next release of the Real Statistics software.
I appreciate your help in improving the quality of the Real Statistics software.
Charles