Objective
In Building a Rasch Model, we show how to identify components that don’t completely fit the model. Two reasons for these discrepancies are subjects with high ability carelessly answering an easy question incorrectly and subjects with poor ability answering a hard question correctly by guessing. We now look at patterns that help detect these sorts of problems.
Subject ability < Item difficulty
We look for cells in Figure 1 of Building a Rasch Model where the subject answered the item correctly but the subject’s ability is less than the item’s difficulty. These cells, shown as an “x” on the left side of Figure 1, may represent potential guesses. E.g. we see that subject B answered item 9 correctly (1 in cell J6 of Figure 1 of Building a Rasch Model), but subject B’s ability of 2.59 (cell AX5 of Figure 5 of Building a Rasch Model) is less than item 9’s difficulty of 3.89 (cell AV13 of Figure 5 of Building a Rasch Model).
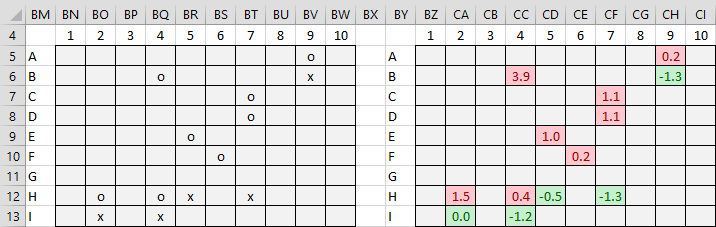
Figure 1 – Guessing
One such case could simply be coincidental, but a couple of these might be indicative of guessing.
As we can see from cells BO13 and BQ13, subject I answered both items 2 and 4 correctly, even though the difficulty of these items is greater than subject I’s ability, an indication of possible guessing. However, there is some doubt about this when we look at the actual differences between the ability and difficulty values, as shown in cells CA13 and CC13. We see that although item 2’s difficulty is greater than subject I’s ability, this difference is negligible. This is consistent with the fact that the corresponding cell (AO27) is not flagged as a non-fit in Figure 6 of Building a Rasch Model.
Subject misses easy questions
More likely an indication of guessing are items 5 and 7 of subject H. We also see that subject H also missed two easy questions (items 2 and 4), indicated by “o” in cells BO12 and BQ12 (here the ability values are greater than the difficulty values but the scores are zero, indicating that the subject answered the question incorrectly. Perhaps this is evidence that subject H carelessly answered these easy questions incorrectly, but it seems as likely or more likely that subject H is doing a lot of guessing.
Addressing guessing
One approach for addressing guessing is to replace suspect responses with a blank score in the raw data and then rerun the Rasch analysis to see whether this results in noticeable changes to a subject’s ability parameter.
Note that we used the following formula in cell BN5 (where the cells in range AN4:AX13 refer to the spreadsheet shown in Figure 6 of Building a Rasch Model).
=IF(B5=””,””,IF(B5=1,IF($AX4<AN$13,”x”,””),IF(B5=0,IF(AN$13<$AX4,”o”,””))))
and the following formula in cell BZ5:
=IF(B5=””,””,IF(B5=1,IF($AX4<AN$13,$AX4-AN$13,””), IF(B5=0,IF(AN$13<$AX4,$AX4-AN$13,””))))
The other cells can be filled in by highlighting the appropriate range and using Ctrl-D and Ctrl-R.
Using conditional formatting
We can also add highlighting (as shown on the right side of Figure 6 of Building a Rasch Model) by using conditional formatting. You need to apply three sets of formatting rules: one to not highlight blank cells, one to highlight cells with negative values, and the third to highlight cells with positive values.
For the first of these formatting rules, highlight the range BZ5:CI13 and select Home > Styles|Conditional Formatting. In the dropdown menu that appears select New Rules. Fill in the dialog box that appears as shown in Figure 2.
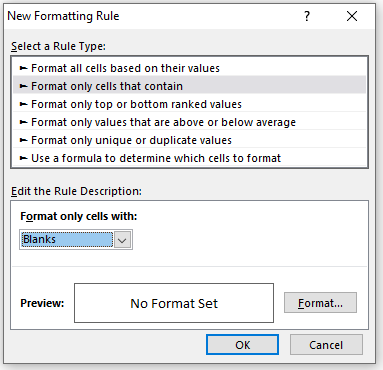
Figure 2 – Rule to not highlight blank cells
For the other two rules follow the approach described in Building a Rasch Model. Now if you highlight the range BZ5:CI13 and select Home > Styles|Conditional Formatting and then choose Manage Rules… from the dropdown menu that appears, the dialog box shown in Figure 3 appears.
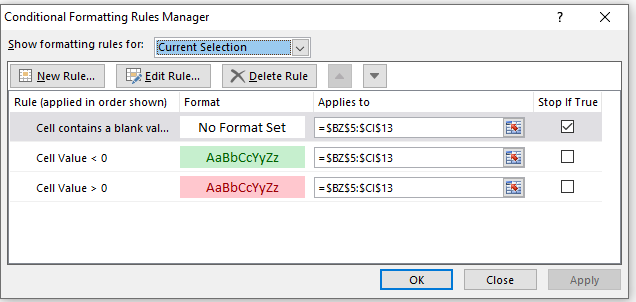
Figure 3 – Conditional Formatting Rules
It is important to make sure that the rule regarding blank cells appears first in the list and to check the Stop If True checkbox. This ensures that the other rules are not applied if a cell is empty. We could have also done this with the second rule, but this is optional. If this rule doesn’t appear first in the list you can click on that rule and use the upward arrow (next to the Delete Rule button) to move that rule into the correct position. After pressing the OK button, you will obtain the desired highlighting.
Examples Workbook
Click here to download the Excel workbook with the examples described on this webpage.
References
Moultan, M. H. (2003) Rasch estimation demonstration spreadsheet
https://www.rasch.org/moulton.htm
Wright, B. D. and Masters, J. N. (1982) Rating scale analysis. MESA Press: Chicago, IL
https://research.acer.edu.au/measurement/2/