Basic Concepts
TC is the average of Kendall’s rank-order correlation coefficient between each judge and the criterion ranking.
To calculate TC, first, create a preference matrix P = [aij] as described in Kendall’s u for Paired Rankings. TC can be calculated via any of the following equivalent formulas
![]()
where k = the number of judges, n = the number of criteria, and
![]()
A+ is the sum of the entries in the preference matrix above the diagonal. It is equal to the number of agreements in ranking the criteria among the judges. Similarly, A– is the sum of the entries in the preference matrix below the diagonal. It is equal to the number of disagreements in ranking the criteria among the judges.
Hypothesis Test
You can test the null hypothesis that the population parameter corresponding to TC, i.e. there is no significant agreement among the judges via the z test statistic
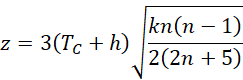
which has a standard normal distribution, where
![]()
Example
Example 1: Calculate TC for the data in Figure 1 and determine whether there is significant agreement between the judges.
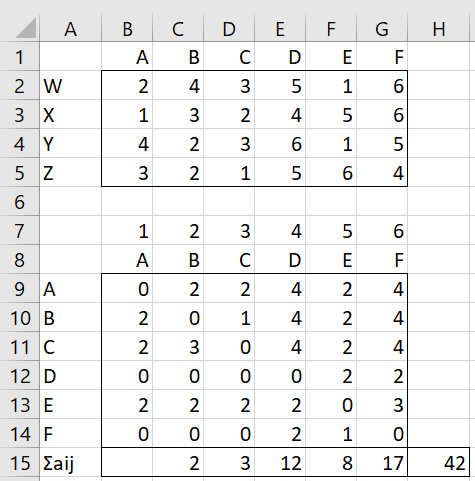
Figure 1 – Ranking data + preference matrix
The preference matrix and A+ = ∑i<j aij is calculated as in Example 1 for Kendall’s u for Paired Rankings. In particular, the preference matrix in range B9:G14 can be calculated by the formula =PREF_MATRIX(B2:G5).
TC is now calculated and tested as shown in Figure 2.
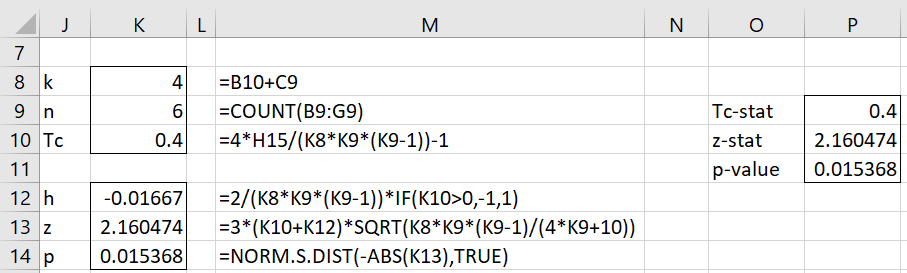
Figure 2 – TC analysis
We see from the figure that p-value = .015368 (cell K14), and so we conclude there is significant agreement between the judges (i.e. the population parameter corresponding to TC is significantly different from zero).
Worksheet Functions
Real Statistics Function: The Real Statistics Resource Pack provides the following function for R1 that contains a preference matrix (without headings).
TC_TEST(R1, lab, alpha): returns a column array with TC-stat, z-stat, and p-value for Kendall’s TC test on the square preference matrix in R1 (without headings).
If lab = TRUE (default FALSE) then an extra column of labels is appended to the output. alpha is the significance level (default .05).
For Example 1, the formula =TC_TEST(B9:G14,TRUE) produces the output shown in range O9:P11 of Figure 1.
Table Lookup
When k = 2 or 3 and 2 ≤ n ≤ 5, then a table lookup is used instead of the normal approximation described above when the lookup argument is set to TRUE (default). In this case, the z-stat field in the output from the TC_TEST formula takes the value N/A.
In addition, the Real Statistics Resource Pack provides the following worksheet function to generate the p-value for the test in these cases.
TC_PROB(k, n, TC) = p-value for Kendall’s TC test when the number of judges is k and the number of criteria being rated is n for the specified value of TC.
For example, =TC_PROB(3, 5, .4) takes the value .06.
Examples Workbook
Click here to download the Excel workbook with the examples described on this webpage.
Links
Reference
Siegel, S., Castellan, N. J. (1988) Nonparametric statistics for the behavioral sciences, 2nd ed.
https://psycnet.apa.org/record/1988-97307-000